...
When you right-click on an icon, a context-sensitive menu appears.


Choose examine to quickly see the structure of the GRIB file.
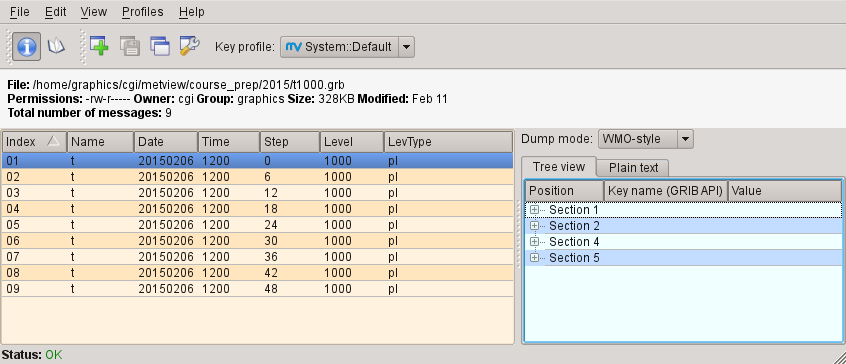
It contains multiple fields, each listed in the left-hand panel of the GRIB Examiner. We will look more closely at this tool later, but for now close it.
...
First, create a new Coastlines icon. You can right-click within the Metview desktop to obtain a context menu from where the option Create new icon is available (shortcut: CTRL-N).
![]()
![]()
![]()
This brings up a dialogue from where you can find the Coastlines icon; either double-click the icon, or drag it onto the desktop to create a new instance. Close the dialogue.
...
Your Coastlines icon can be dragged into any plot, and later we’ll see how to store useful icons so that they can be easily accessed from anywhere.
So you know what it does, rename the icon to land_shade by clicking on its name and editing the text.
Changing the Map Projection and Storing the Area
...
Create a new Geographic View icon and rename it to polar_europe by clicking on its name and editing the text. Edit the icon and change the following parameter:
...
Linking the Coastlines icon with the Geographic View Icon
XXX
Creating a Simple Macro
Metview incorporates a powerful Macro language, which can be used for tasks ranging from simple automation of tasks to complex post-processing of data. We will now create a simple macro which reads the GRIB file and plots it in our chosen projection.
Create a new Macro icon and edit it. This time we see a code editor, custom-built for the Macro language. The editor can automatically translate Metview icons into Macro code, so do the following:
drop the t1000.grb icon into the Macro Editor; a variable called
t1000_2e_grbis assigned to the value of theread()command, which reads the GRIB data- rename the variable to simply
t1000 - drop your polar_europe icon into the Macro Editor
- drop your Coastlines icon into the Macro Editor
- underneath the generated code, type the following line:
| Code Block |
|---|
plot(polar_europe, coastlines, t1000) |
This says, "In the polar_europe view, using the coastlines definition, plot data t1000".
Your complete macro should look like this:
Although they can be used separately, the Coastlines icon can be linked into the Geographic View icon through the concept of embedded icons.
Notice that a Geographical View icon editor contains a place for an embedded Coastlines icon. If you drop a Coastlines icon here and apply the changes, then the Geographical View icon will use your chosen coastlines.
![]()
Try it with your land_shade and polar_europe icons, and test the result by visualising polar_europe.
Creating a Simple Macro
Metview incorporates a powerful Macro language, which can be used for tasks ranging from simple automation of tasks to complex post-processing of data. We will now create a simple macro which reads the GRIB file and plots it in our chosen projection.
Create a new Macro icon and edit it. This time we see a code editor, custom-built for the Macro language. The editor can automatically translate Metview icons into Macro code, so do the following:
drop the t1000.grb icon into the Macro Editor; a variable called
t1000_2e_grbis assigned to the value of theread()command, which reads the GRIB data- rename the variable to simply
t1000 - drop your polar_europe icon into the Macro Editor
- underneath the generated code, type the following line:
| Code Block |
|---|
plot(polar_europe, t1000) |
This says, "In the polar_europe view, plot data t1000".
Your complete macro should look like this:
| Code Block | ||
|---|---|---|
| ||
# Metview Macro

t1000 = read("/path/to/user/metview/t1000.grb")

land_shade = mcoast(
    map_coastline_thickness         : 2,
    map_coastline_land_shade        : "on",
    map_coastline_land_shade_colour : "cream"
| ||
| Code Block | ||
| ||
# Metview Macro t1000 = read("/path/to/user/metview/t1000.grb") polar_europe = geoview( map_projection : "polar_stereographic", map_area_definition : "corners", area : [30,-25,50,65] ) coastlines = mcoast( map_coastline_thickness : 2[30,-25,50,65], map_coastline_land_shade coastlines : "on", : map_coastline_land_shade_colour : "cream" ) plot(polar_europe, coastlines, t1000) |
Now run the macro to generate the plot.
...
| Code Block |
|---|
plot(polar_europe, coastlines, t1000, fixed_t) |
Visual definition variables must appear just after the data variables to which they are to be applied. In fact, now that we have a shaded field covering the whole globe, there is no need to shade the land; we can remove the coastlines element from the plot() command polar_europe definition. We will still see the coastlines, but Metview will use the default coastline definition, which is to draw the outline without shading the sea or the land.
...