...
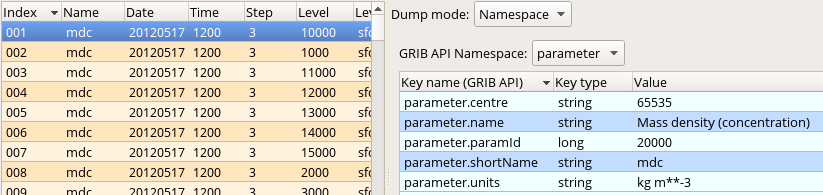
Before seeing the macro code to generate the plot we inspect the file itself we wanted to plot. Double-click on the 'conc_s001.grib' GRIB icon' in folder 'result_fw_conc' to start up the Grib Examiner. We can see that this file contains the "mdc" (=Mass density concentration) fields we want to visualise. We can find out further details about this parameter by setting the Dump mode to Namespace and Namespace to Parameter:

Generating the plot
...