Introduction
A forecast 'bust' is typically associated with a sudden and pronounced drop in forecast performance. The standard way of assessing the performance of a single forecast is to calculate how well the height of the 500-hPa pressure field (Z500) agrees with the observed outcome. The agreement is typically quantified by calculating the area-averaged root-mean-square error (RMSE) or the spatial anomaly correlation coefficient (ACC).
This case study looks at an example of a 'forecast bust' from April 2011 over Europe. The reference for this case study is:
| Panel | ||
|---|---|---|
| ||
Rodwell, M.J. et al, (2013). Characteristics of occasional poor medium-range weather forecasts for Europe. Bull. Am. Meteorol. Soc., 94(9) 1393–1405. DOI: http://dx.doi.org/10.1175/BAMS-D-12-00099.1 Rodwell, M. J., et al, 2012a: Characteristics of occasional poor medium-range forecasts for Europe. ECMWF Newsletter No. 131, ECMWF, Reading, United Kingdom, 11–15. |
Case study aims
Possible approaches to studying this case are:
- Characteristics of forecast bust compared to analyses.
- Role of organised convection over the USA.
- Understanding Rossy wave development associated with the forecast bust.
- Use of ensembles.
- Sensitivity to parametrized physics processes, particularly vertical mixing.
Initial conditions
| Info |
|---|
Note: The initial conditions data for the case studies described here are available for OpenIFS 40r1. Please contact OpenIFS Support if you require initial experiment data for more recent model version. |
Case study initial conditions are provided on the OpenIFS ftp site. The ftp site is password protected, only licensed institutes may be provided with the ftp password. Please contact openifs-support@ecmwf.int.
The initial conditions are available for different resolutions and start dates. The experiment ids listed below are created at ECMWF and used for identifying the model forecasts on the ECMWF archive system (for those with access).
Note that ERA-Interim has a horizontal resolution of T255.
| Info |
|---|
As OpenIFS is a spectral model, the 'T' number refers to the triangular truncation in spectral space. Equivalent grid resolutions are: The number of vertical levels is given after the letter 'L' e.g. L62 means 62 vertical levels. Please note that higher resolutions progressively require more processors and computer memory to run. |
| Panel | ||||||||||||||||||||||||
|---|---|---|---|---|---|---|---|---|---|---|---|---|---|---|---|---|---|---|---|---|---|---|---|---|
| ||||||||||||||||||||||||
Note, all experiments are configured to have the wave model turned off. All initial data supports 10 day forecasts. Additional days are available (not all are provided due to space constraints), please contact openifs-support@ecmwf.int. To uncompress and unpack using the |
| Panel | ||||||||||||
|---|---|---|---|---|---|---|---|---|---|---|---|---|
| ||||||||||||
The following dataset includes start files for a control + 50 ensemble members. Single resolution EPS for 10 days.
To uncompress and unpack using the |
Download instructions
| Code Block | ||
|---|---|---|
| ||
% mkdir -p runs/fc_bust/t255 % cd runs/fc_bust/t255 % ftp ftp.ecmwf.int ftp> cd case_studies/forecast_bust_2011 ftp> binary ftp> get T255_gj3e_2011041000.tgz ftp> quit % tar zxf T255_gj3e_2011041000.tgz % ls 2011041000 ICMCLgj3eINIT ICMGGgj3eINIT ICMGGgj3eINIUA ICMSHgj3eINIT ecmwf % ls 2011041000/ecmwf NODE.001_01 ifs.stat.model namelistfc |
The 'ecmwf' directory contains the files produced at ECMWF when this experiment was run:
namelistfc: copy this file to 'fort.4' to run the experiment (modify as required)NODE.001_01: this is the model output file as run at ECMWF. If your run fails, it may be useful to compare with this file.
Comments
The forecasting system at ECMWF makes use of "ensembles" of forecasts to account for errors in the initial state. In reality, the forecast depends on the initial state in a much more complex way than just the model resolution or starting date. At ECMWF many initial states are created for the same starting time by use of "singular vectors" and "ensemble data assimilation" techniques which change the vertical structure of the initial perturbations.
As further reading and an extension of this case study, research how these methods work.
Acknowledgements
The figures on this page are taken from a project on this case study by Lauri Tuppi, University of Helsinki. We are grateful for permission to reproduce them here.
| HTML |
|---|
<script type="text/javascript" src="https://softwarejira.ecmwf.int/issues/s/en_UKet2vtj/787/12/1.2.5/_/download/batch/com.atlassian.jira.collector.plugin.jira-issue-collector-plugin:issuecollector/com.atlassian.jira.collector.plugin.jira-issue-collector-plugin:issuecollector.js?collectorId=5fd84ec6"></script> |
| Excerpt Include | ||||||
|---|---|---|---|---|---|---|
|
| Panel | ||||||||
|---|---|---|---|---|---|---|---|---|
| ||||||||
|
| Panel | ||||||
|---|---|---|---|---|---|---|
| ||||||
Figure shows ACC (%) of a 6 day forecast initialized on dates shown over Europe. (courtesy Lauri Tuppi, University of Helsinki). |

| Panel | ||
|---|---|---|
| ||
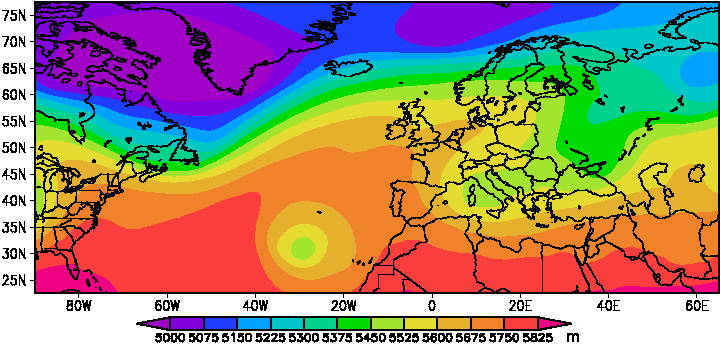
Figure shows 500hPa geopotential height at 16th April 2011 00UTC. Top figure shows the OpenIFS forecast, T255L91, the lower panel is from ERA-Interim. Although the forecast predicted a blocking situation over Europe, this did not occur. (courtesy of Lauri Tuppi, University of Helsinki). |

| Panel | ||||||
|---|---|---|---|---|---|---|
| ||||||
Figure shows the forecast of CAPE and significant error in position and magnitude of CAPE over USA, 6 hrs into forecast, initialized from 10/4/2011 00Z. (courtesy Lauri Tuppi, University of Helsinki) |
