...
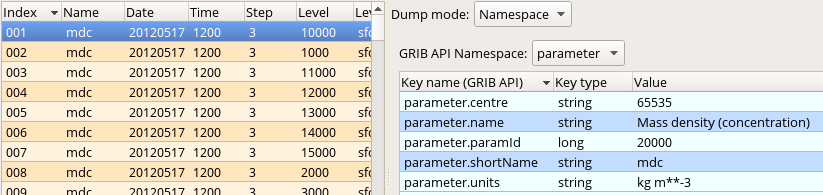
Before seeing the macro code to generate plot the plot data we inspect the file itself we wanted to plotwork with. Double-click on the 'conc_s001.grib' GRIB icon' in folder 'result_fwd' to start up the Grib Examiner. We can see that this our file contains the "mdc" (=Mass density concentration) fields we want to visualise. We can find out further details about this parameter by setting the Dump mode to Namespace and Namespace to Parameter in the examiner:
Generating the plot
The macro to visualise the concentration fields on a given level is 'plot_conc.mv'.
...