Preparation
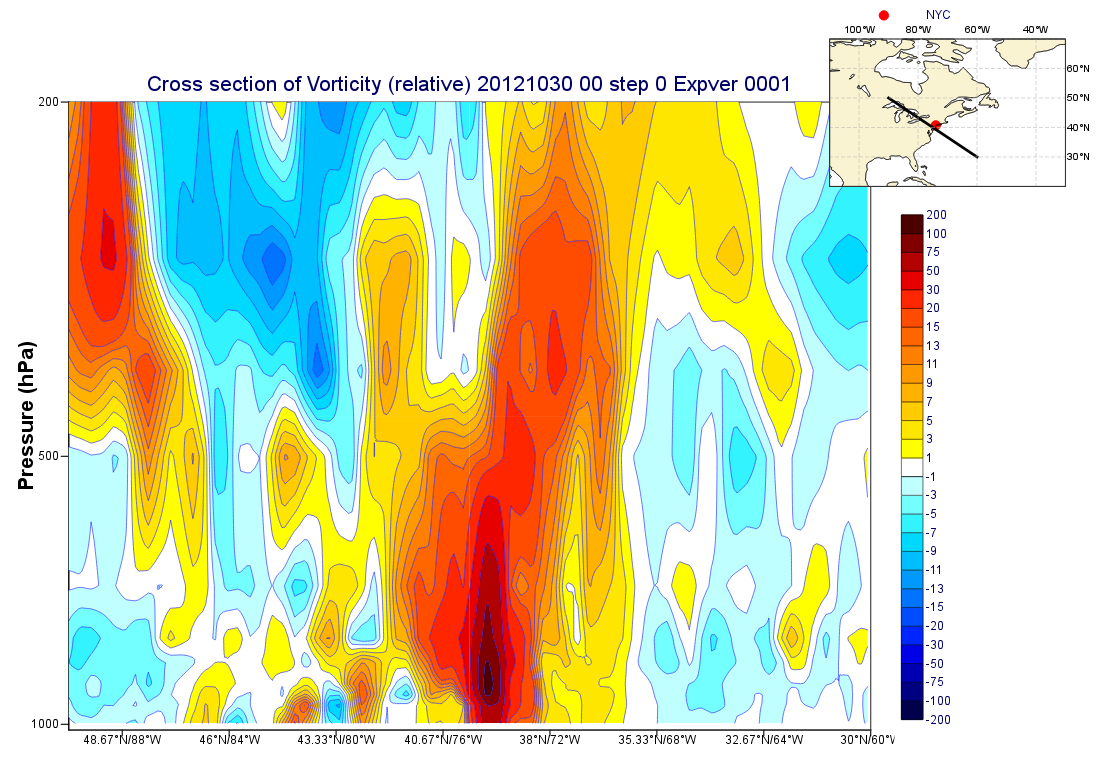
In this exercise we will produce a cross section plot of vorticity through Hurricane Sandy. We will also create a more interesting layout which will include a geographic map showing the path of the cross section line.
XXX Download data
Verify that the data are as expected.
We will prepare the plot interactively using icons. Then, at the end, we will put it all together into a macro. Remember to give your icons useful names!