The annual training course on the ‘Use and interpretation of ECMWF products for WMO Members’ took place the second week of October. The classroom was full for the whole week with students coming from 18 countries.
The week was a tremendous opportunity for forecasters to learn more about the Centre’s products and to network with others from small to medium size Meteorological Services. The enthusiasm and participation in the activities was commendable. We started the week with a team building game whose aim was to understand the usefulness of probability forecast in decision-making followed by lectures and laboratories. The students used a forum to discuss ECMWF products, and the same products were then used to analyse case studies during the practical sessions.
To read more
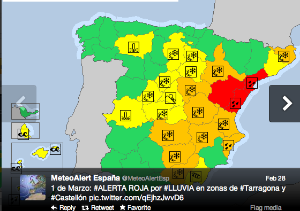
The societal impact of the snow event on Friday 1st March in Spain was rather high. Here below an extract from 'El Mundo' (C. Valenciana, actualizado 17.28 CET):
--------------------------------
La nieve deja atrapados a vehículos, suspende clases y cierra 11 carreteras
- 11 carreteras permanecen cortadas al tráfico y en 24 se precisan cadenas
- La nieve ha superado con creces el metro de altura en puntos de Castellón
--------------------------------
The Spanish Meteorological Service (AEMET) issued a red alert 24h ahead of the event. The alert was visible on the MeteoAlarm website and re-tweeted many times:
 The snowfall EFI had a very strong signal 3 days ahead of the event as indicated in the plot below (left). The 90th percentile of the climate (right) is also displayed as an indication of what an extreme snowfall value of the climate might be.
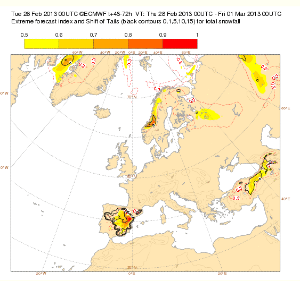
EFI snowfall (D+3)
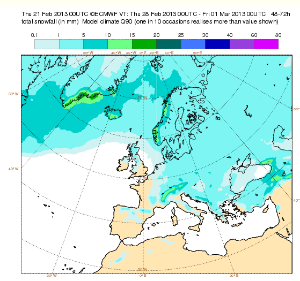
90th percentile climate (snowfall)
The EFI signal becomes even strong as the lead time decreases. This is now the snowfall EFI one day ahead of the event:
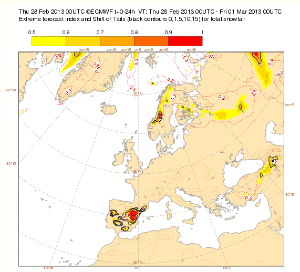
EFI snowfall (D+1)
Towards the end of the week (18th to 24th February), there were floods in Italy and Greece. After a quick check to the EFI, it was evident that the Italian event had not been captured by ENS as a potentially severe weather case. The ENSgram for Catania (even in the very short range) does not show large amounts of accumulated precipitation. The event is likely to be linked to local effects that the model may not be able to resolve.
Much better the forecast for Athens: the short range forecast indicated up to a max of 45mm/24h (median: 20mm/24h). Some indications that the event might be 'severe' was already evident 3 days ahead, but the spread of ENS was rather large. The EFI maps showed a weak signal for 'severe' weather event only a couple of days in advance
On Sunday 30th September I was in Addis Ababa and noticed that the EPSgram for the town had been showing noticeable rain. It rained indeed! The EPSgram for the forecast of the 28th was a little too pessimistic indicating rain for four days in a row. The forecast of the 29th was more specific, with little rain on the 29th and significant rain on the 30th.
Forecast 28th September 2012
Forecast 29th September 2012
The rain only happened on the Sunday and Monday in the early morning. Interestingly, the EFI had a small signal for an area around Addis Ababa (d+1 for the Sunday), even though the rain was not really extreme. I believe the signal is linked to the timing of the dry season which starts usually end of September/beginning of October and the model climate may not capture it correctly. A small phase shift could be the cause of the EFI signal.
This has been an interesting (and still is!) tropical cyclone. Started in the Pacific, rather small and looking not too offensive has deepened and it has been said (still needs to be assessed if true) the category of super-typhoon, just before hitting Okinawa (29th September). Now the typhoon is travelling to the main Japanese mainland east coast.
There are lots of photos on the press. The following is the aftermath of Jelawat in Okinawa:

More photos (worth a look if you are on Facebook!) have been posted by the USA KAdena Airbase
http://www.facebook.com/KadenaAirBase/photos_stream
What about ECMWF forecasts?
The forecast from the 25th September indicated the typhoon to intensify and head for Japan. The forecast trajectory matches quite well the observed trajectory as observed on various websites (needs more objective verifications!). The panels on the right are constructed recording the forecast typhoon characteristics as though sitting on the typhoon and travelling with it (Lagrangian specification). Interestingly, for Thursday 27th the Ens forecast indicates a 5% probability of having a super-typhoon (black shading; needs to carefully check the Thursday boxes on the top right panel ![]() ). The HighRes forecast is always an outlier (black line in the middle and bottom panel on the right. These two panel show wind and central pressure of the typhoon, respectively)
). The HighRes forecast is always an outlier (black line in the middle and bottom panel on the right. These two panel show wind and central pressure of the typhoon, respectively)
Forecast base date: 25th September
A more recent forecast shows the progression of the typhoon, which will decay after affecting the East Coast of Japan. Please note (bottom left panel) that after t+120 not many members are tracked (ie the tropical cyclone is weakened and disappeared).
Forecast base date 27th September
Torrential rains and flash floods affected Andalusia and Murcia on Friday 28th September. The rain came after an extensive period of drought. The press talks about 600 people evacuated and six casualties.
Photos on the press showed people evacuated with boats and mud and water covering streets and the ground floors of buildings:

How did ECMWF forecasts do?
The Extreme Forecast Index (EFI) showed high values three days in advance. The following pdf shows on the left panel the EFI (shading). The red colour indicates the areas where the EFI has its maximum value (EFI=1). The model climate on the right panel tells us the amount of precipitation for the 99th percentile of the climate, which in the area of the flood is between 10 and 20 mm/24h (green shading):
:
The EPSgram for a location on the Spanish South-east coast indicates (left panel below) that the accumulated precipitation for a 24 hour period are for the majority of the Ensemble Members well above the climate (thin green line). In fact the forecast for Friday 28th, shows that from the 25th percentile upwards, the accumulated amounts are above the 99th percentile of the climate:

15day EPSgram

Ensemble Cumulative Distribution Functions
The file on the right shows the EPS distribution for the same location as the EPSgram. The top panel is the feature we are interested in and it shows the Cumulative Distribution Function (CDF) for the 10 forecast runs all verifying on the 28-29th (accumulated) September. The climate is in black. All the forecast runs indicated that there would be more rain than it would be expected if we took the climate as forecast. A particular shift to the right happens for the d+3 forecast range with a bunch of curves that move to the right suggesting very large extreme values (>50mm/24h). There is some spread in the EPS members as to what it should be the amounts of precipitation: for example following the red curve one notices values from >10mm/24h to >60mm/24h: they are obviously associated to a different probability of happening!
First of all, the following plot shows the observations (as they are from GTS). Top row is the threee individual 24h periods, borttom are the 48h and 72h accumulations. Sunday the rain was mostly in the southern areas, by Monday it moved to north, and Tuesday it stayed there but the amounts were less extreme. The 72h total shows up as over 100m even with this sparse coverage (especially in the flood affected region). Orange corresponds to 30-50 mm, red to 50-75 mm and purple to 75-100 mm.

On the following plots always 8 model runs appear (if available verifying on the corresponding period) starting from top left going to the right. The 1st and 3rd rows are ECMWF, the 2nd and 4th rows are UKMO forecasts. The bottom right corner shows the observations. The colour scheme is the simila in the forecasts and the observation. Orange corresponds to 30-50 mm, red to 50-75 mm and purple to 75-100 mm.
- For Sunday the MetOffice is better, the EC timing is quite bad, the rain goes too far north (execpt one UKMO run, which missed the event completely).

- For Monday it is more mixed, first the EC forecasts are better, showing consistently the large precip, even if too far north. Later, closer to the event, the EC forecasts are surprisingly bad, the precip is way too far north, and also not enough.

Nadine's future remains as uncertain as it was in the previous forecasts for both its intensity and its track. The extra-tropical tracker again shows two possible movement: eastward and westward.
According to the high-resolution forecast Nadine will move north-eastwards behaving as tropical-like feature. Then it will penetrate inland into the Iberian peninsular dying quickly or merging with a bigger trough.
GFS in its last run from 06UTC predicted a little bit different behaviour of Nadine: again north-eastwards motion, more easterly track, earlier in the forecast and living longer inland causing torrential rain in Portugal and Spain.
Comparing day 6 forecast from the main centres we will see how different they are.
The possibility of Nadine hitting the Iberian peninsular seems to be well captured in EFI forecast of 10-metre wind gusts. The SOT valued are also quite big.