| Name
|
Size
|
Creator |
Creation Date
|
Last Modification Date
|
Labels |
Attached To |
|
PNG File Fig9.3.3 Life cycle of a depression.png |
457 kB |
Bob Owens |
Aug 25, 2022 10:11 |
Aug 25, 2022 10:11 |
|
Page: Section 9.3 Surface Wind
|
|
PNG File FigXY8 Surface Wind from 40m.png |
43 kB |
Bob Owens |
Aug 25, 2022 10:11 |
Aug 25, 2022 10:11 |
|
Page: Section 9.3 Surface Wind
|
|
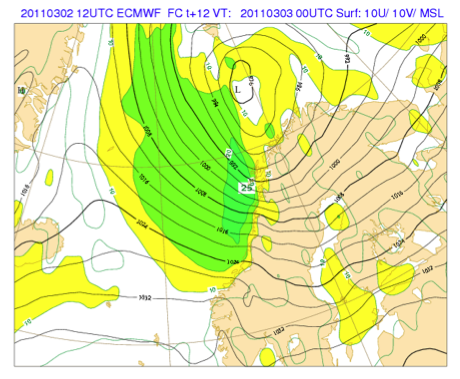
PNG File Fig2 Wind inconsistencies.png |
184 kB |
Bob Owens |
Aug 25, 2022 10:11 |
Aug 25, 2022 10:11 |
|
Page: Section 9.3 Surface Wind
|
|
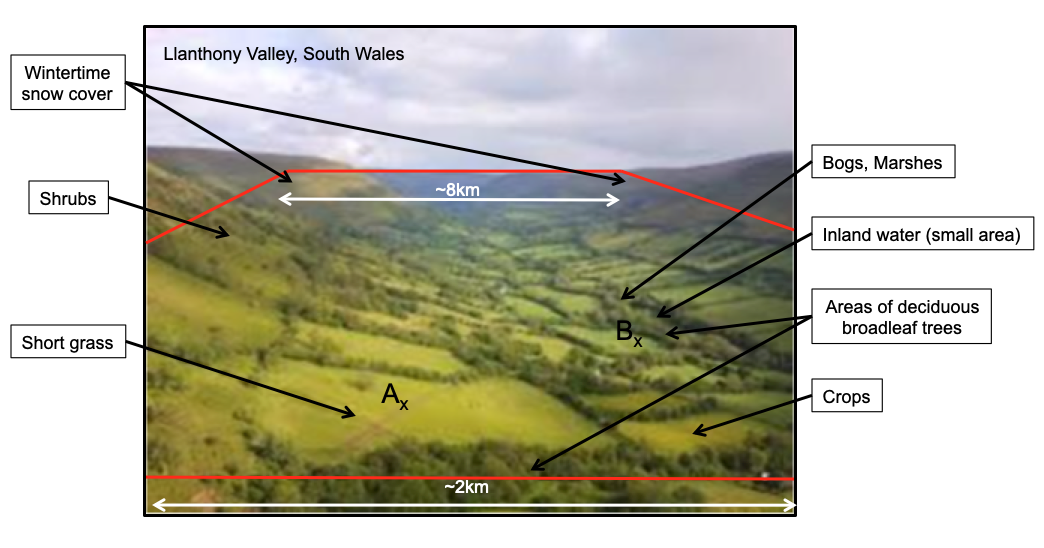
PNG File Roughness Variability Photo Llanthony Valley.png |
517 kB |
Bob Owens |
Aug 25, 2022 10:11 |
Aug 25, 2022 10:11 |
|
Page: Section 9.3 Surface Wind
|
|
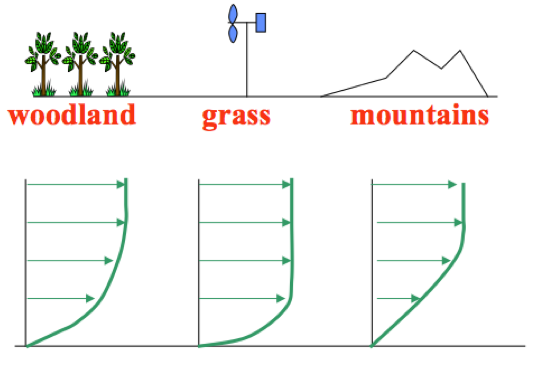
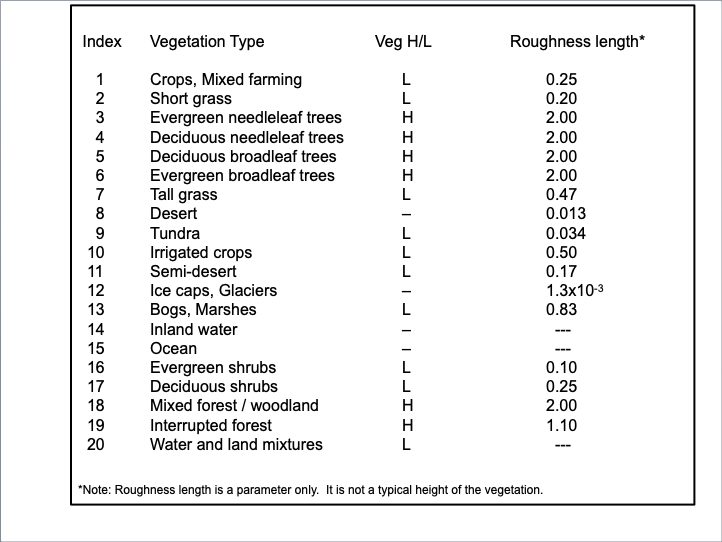
PNG File Roughness Length.png |
81 kB |
Bob Owens |
Aug 25, 2022 10:11 |
Aug 25, 2022 10:11 |
|
Page: Section 9.3 Surface Wind
|
|
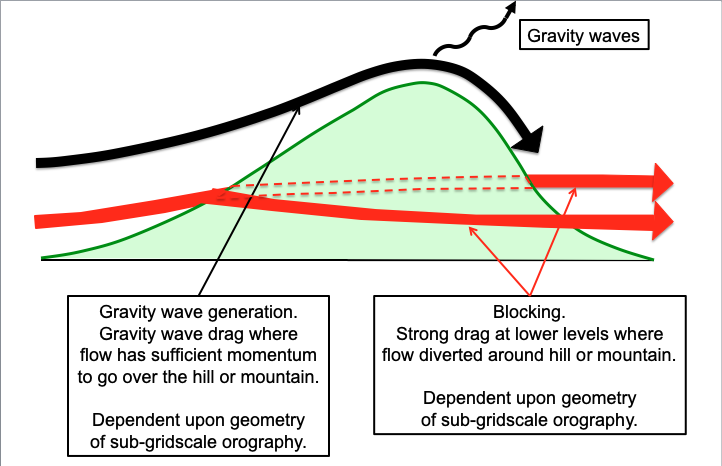
PNG File Sub-gridscale drag.png |
81 kB |
Bob Owens |
Aug 25, 2022 10:11 |
Aug 25, 2022 10:11 |
|
Page: Section 9.3 Surface Wind
|
|
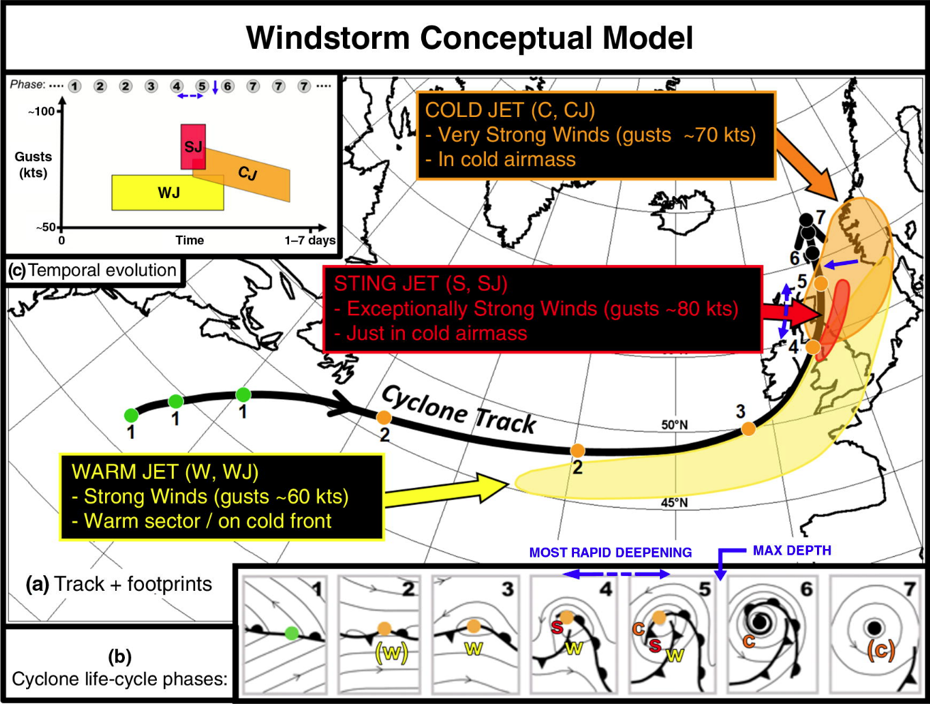
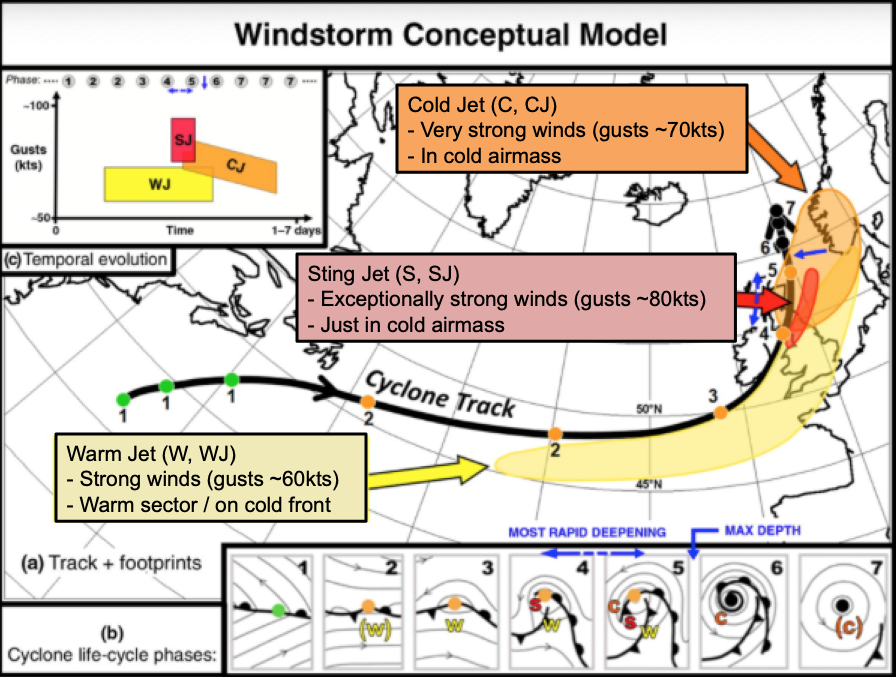
PNG File Windstorm Conceptual Model.png |
428 kB |
Bob Owens |
Aug 25, 2022 10:11 |
Aug 25, 2022 10:11 |
|
Page: Section 9.3 Surface Wind
|
|
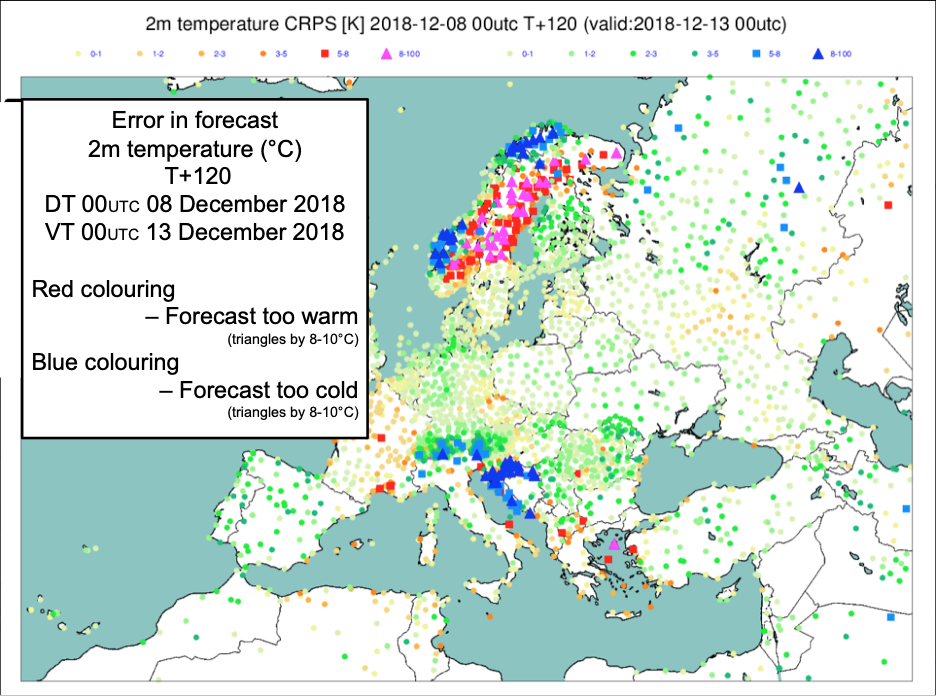
PNG File T2m Errors Dec2018 Section9.2.1 Fig1.png |
497 kB |
Bob Owens |
Aug 25, 2022 10:09 |
Aug 25, 2022 10:09 |
|
Page: Section 9.2.2 Regional Temperature Biases
|
|
PNG File Fig FC against Obs.png |
124 kB |
Bob Owens |
Aug 25, 2022 10:08 |
Aug 25, 2022 10:08 |
|
Page: Section 9.2.1 Causes of Errors in Forecast Temperature and Humidity
|
|
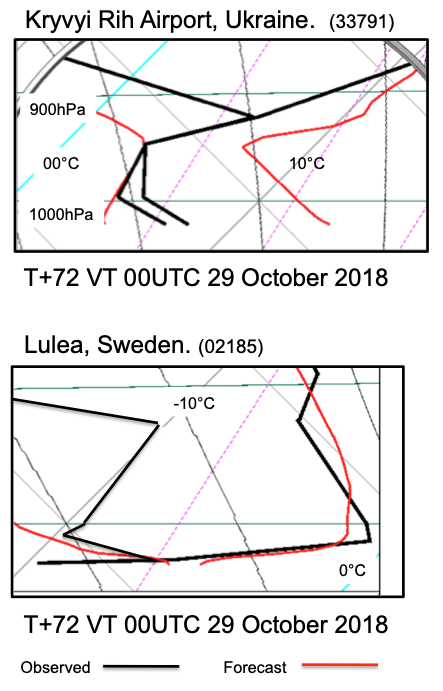
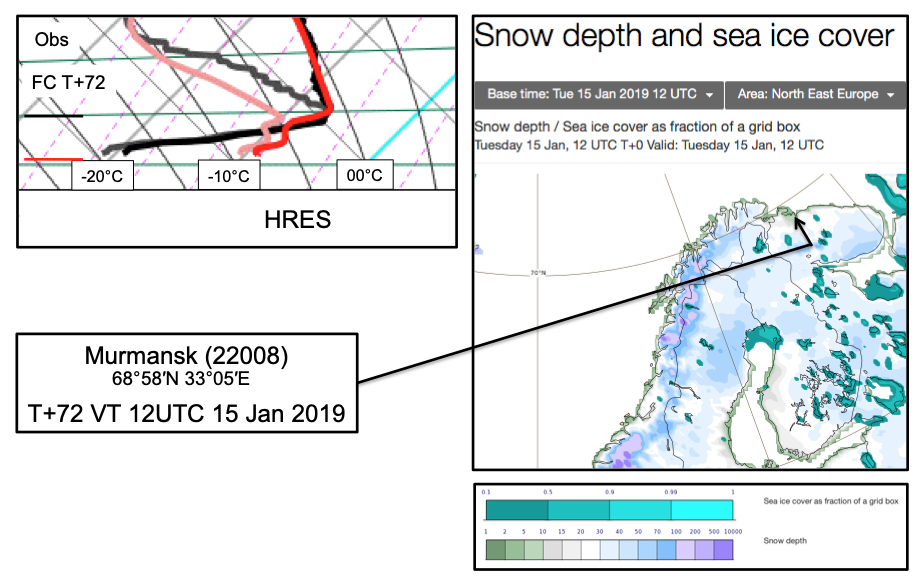
PNG File Fig Forecast Tephi and Snow Cover.png |
299 kB |
Bob Owens |
Aug 25, 2022 10:08 |
Aug 25, 2022 10:08 |
|
Page: Section 9.2.1 Causes of Errors in Forecast Temperature and Humidity
|
|
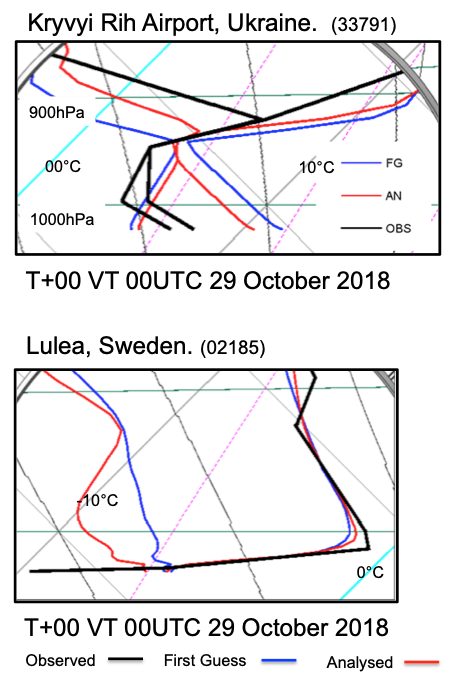
PNG File FigFirstGuess Obs and Analysed .png |
143 kB |
Bob Owens |
Aug 25, 2022 10:08 |
Aug 25, 2022 10:08 |
|
Page: Section 9.2.1 Causes of Errors in Forecast Temperature and Humidity
|
|
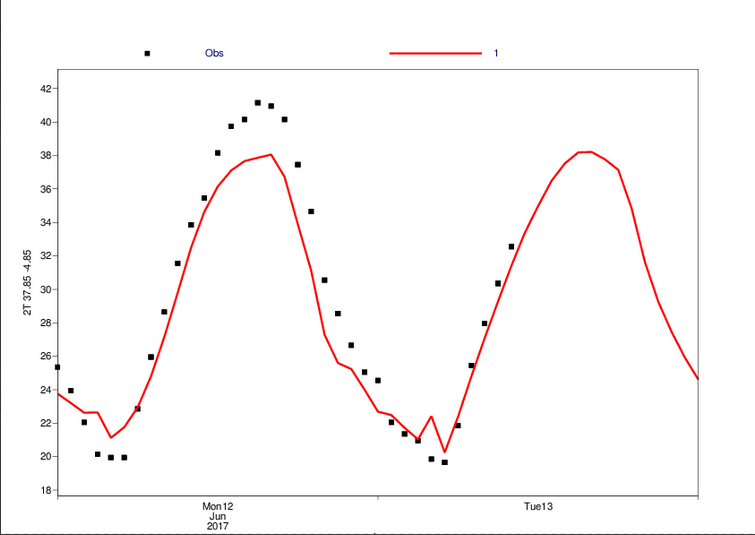
PNG File Fig6.5.3B ModelDewpointsHighCordoba.png |
41 kB |
Bob Owens |
Aug 25, 2022 10:08 |
Aug 25, 2022 10:08 |
|
Page: Section 9.2.1 Causes of Errors in Forecast Temperature and Humidity
|
|
PNG File Fig6.5.3A ModelTempsLowCordoba.png |
51 kB |
Bob Owens |
Aug 25, 2022 10:08 |
Aug 25, 2022 10:08 |
|
Page: Section 9.2.1 Causes of Errors in Forecast Temperature and Humidity
|
|
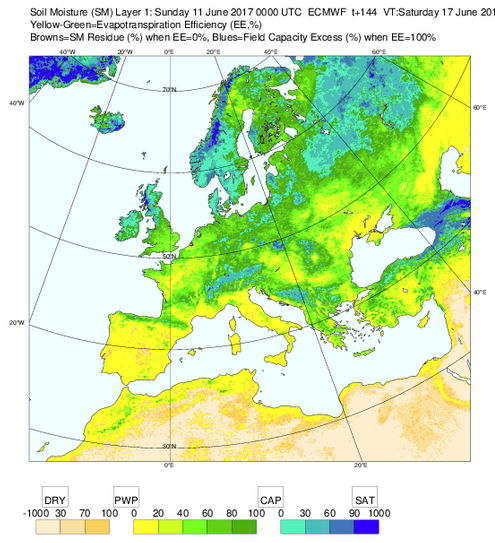
PNG File Fig6.5.3C SoilMoistureCordoba.png |
316 kB |
Bob Owens |
Aug 25, 2022 10:08 |
Aug 25, 2022 10:08 |
|
Page: Section 9.2.1 Causes of Errors in Forecast Temperature and Humidity
|
|
PNG File Fig6.5.3A ModelTempsLowCordoba.png |
51 kB |
Bob Owens |
Aug 25, 2022 10:08 |
Aug 25, 2022 10:08 |
|
Page: Section 9.2.1 Causes of Errors in Forecast Temperature and Humidity
|
|
PNG File Fig6.5.3C SoilMoistureCordoba.png |
316 kB |
Bob Owens |
Aug 25, 2022 10:08 |
Aug 25, 2022 10:08 |
|
Page: Section 9.2 Screen Level Temperatures and Moisture
|
|
PNG File Fig6.5.3B ModelDewpointsHighCordoba.png |
41 kB |
Bob Owens |
Aug 25, 2022 10:08 |
Aug 25, 2022 10:08 |
|
Page: Section 9.2 Screen Level Temperatures and Moisture
|
|
PNG File Fig6.5.3A ModelTempsLowCordoba.png |
51 kB |
Bob Owens |
Aug 25, 2022 10:08 |
Aug 25, 2022 10:08 |
|
Page: Section 9.2 Screen Level Temperatures and Moisture
|
|
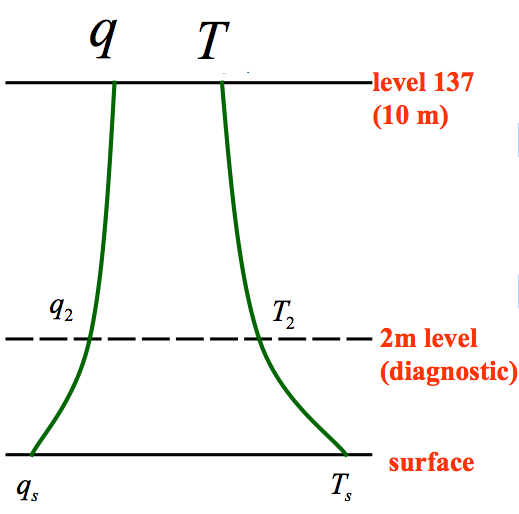
PNG File FigXX5 Derive 2m temp:hum.png |
28 kB |
Bob Owens |
Aug 25, 2022 10:08 |
Aug 25, 2022 10:08 |
|
Page: Section 9.2 Screen Level Temperatures and Moisture
|
|
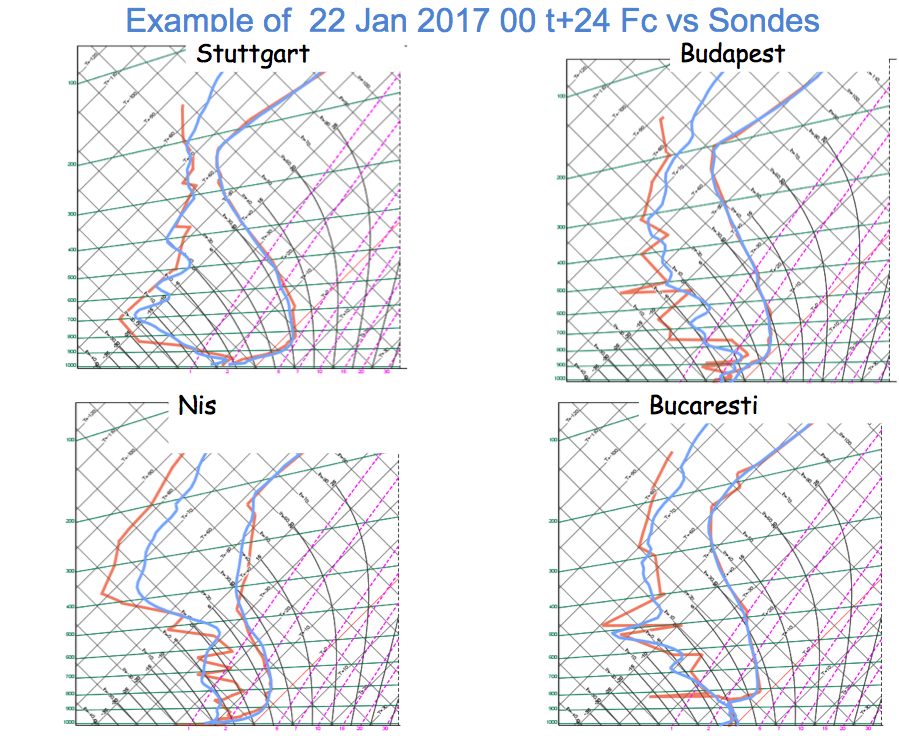
PNG File Examples of boundary layer tephis.png |
488 kB |
Bob Owens |
Aug 25, 2022 10:07 |
Aug 25, 2022 10:07 |
|
Page: Section 9.1 Model Boundary and Surface Layers
|