| Name
|
Size
|
Creator |
Creation Date
|
Last Modification Date
|
Labels |
Attached To |
|
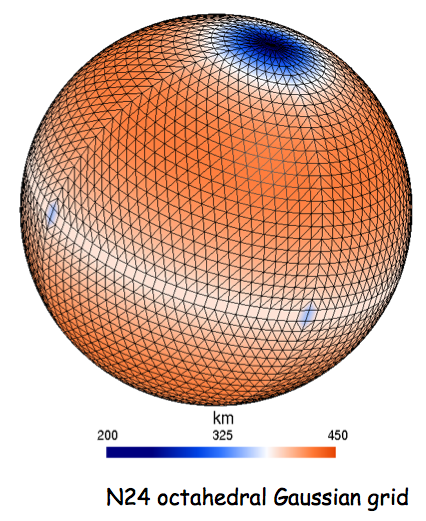
PNG File FigXX4A New Grid Coverage.png |
305 kB |
Bob Owens |
Sept 06, 2022 20:45 |
Sept 06, 2022 20:45 |
|
Page: Section 2.1.1.1 Grid point Resolution
|
|
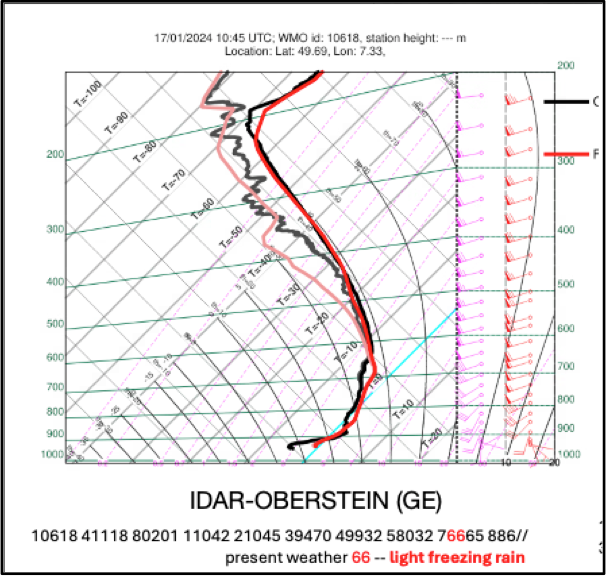
PNG File Screenshot 2024-02-02 at 22.32.21.png |
304 kB |
Bob Owens |
Mar 14, 2024 12:16 |
Mar 14, 2024 12:16 |
|
Page: Section8.1.10.1 Examples of freezing precipitation - charts and diagrams
|
|
PNG File Screenshot 2024-02-02 at 22.32.21.png |
304 kB |
Bob Owens |
Feb 02, 2024 22:33 |
Feb 02, 2024 22:33 |
|
Page: Section 8.1.10 Types of Precipitation - charts and diagrams
|
|
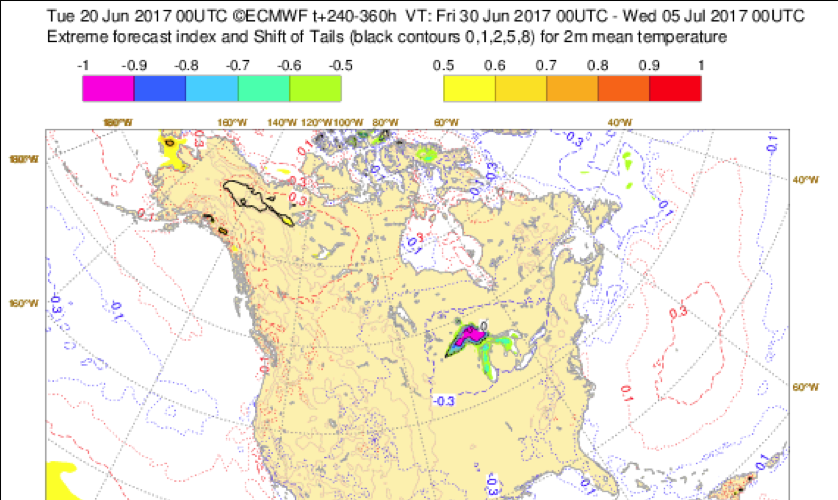
PNG File Fig8.6.1.1A Great Lakes Error.png |
302 kB |
Bob Owens |
Apr 14, 2023 16:22 |
Apr 14, 2023 16:22 |
|
Page: Section 5.3.4 Reanalyses and Re-forecasts
|
|
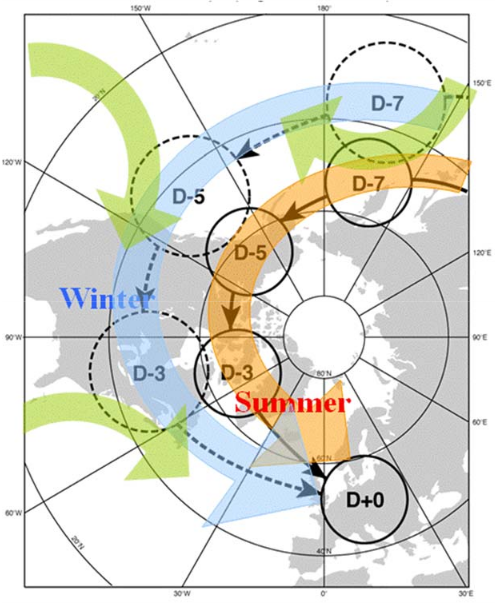
PNG File Fig16A.png |
302 kB |
Bob Owens |
Aug 23, 2022 16:54 |
Aug 23, 2022 16:54 |
|
Page: Section 4.3 Downstream spread of influence
|
|
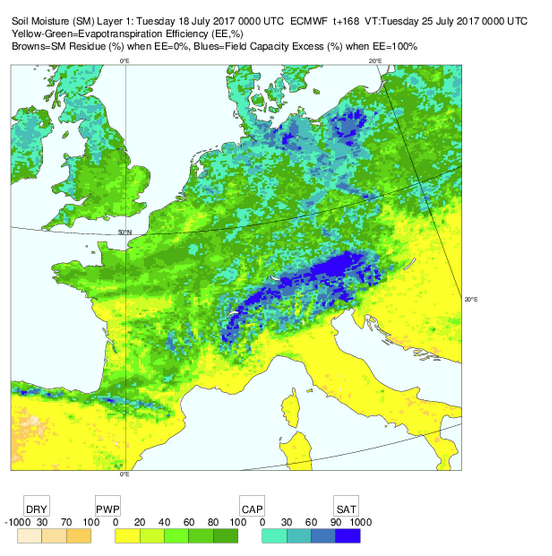
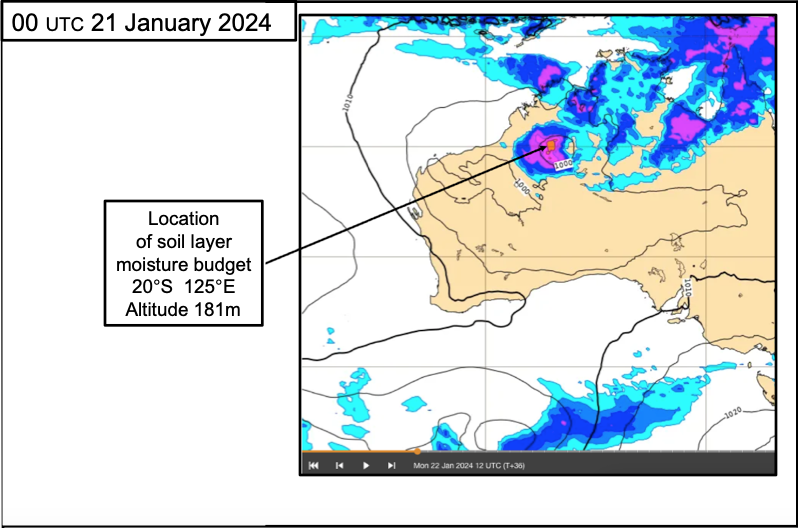
PNG File Fig2.1.3.3B Soil Moisture T+168.png |
299 kB |
Bob Owens |
Mar 06, 2023 16:35 |
Mar 06, 2023 16:35 |
|
Page: Section 2.1.4.5 Modelling soil structure
|
|
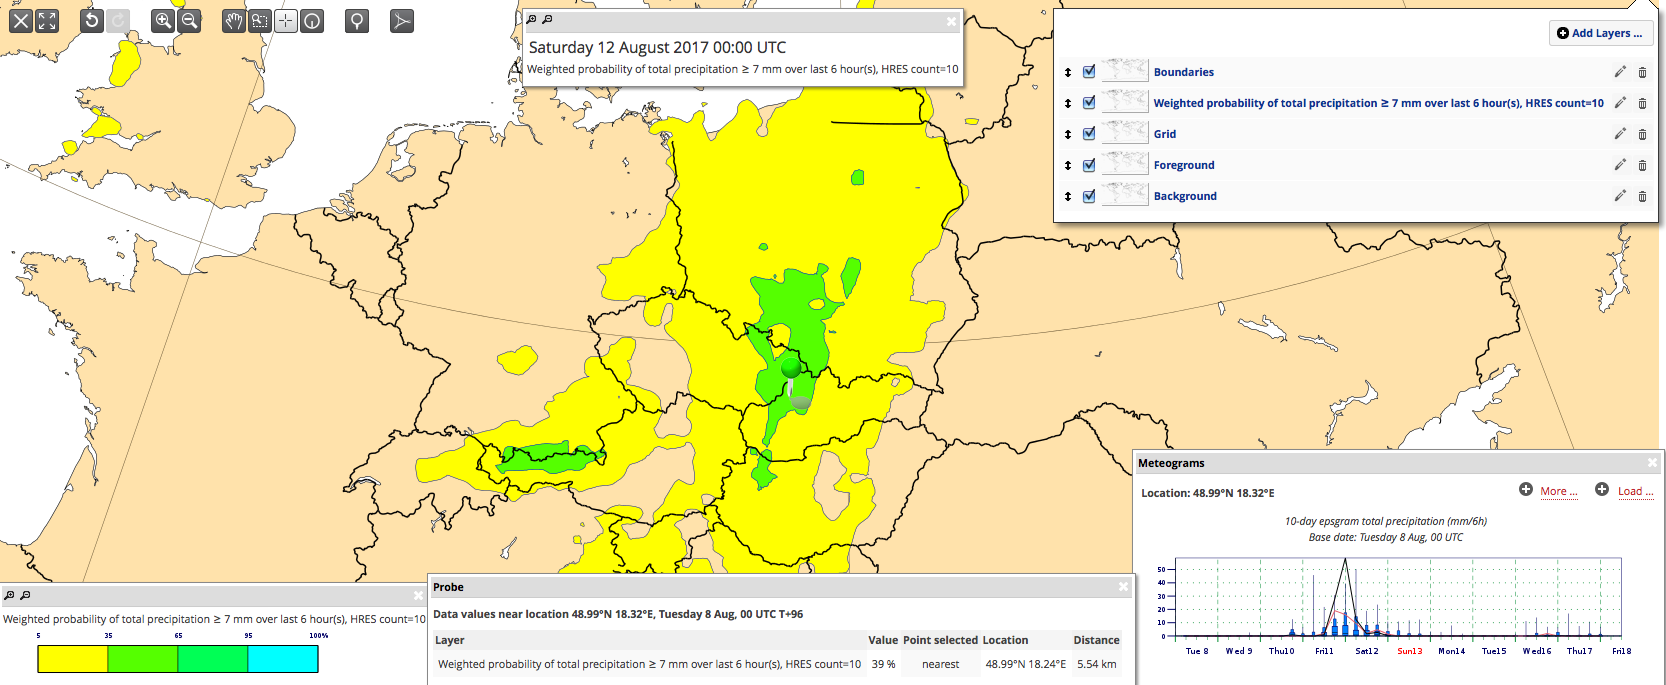
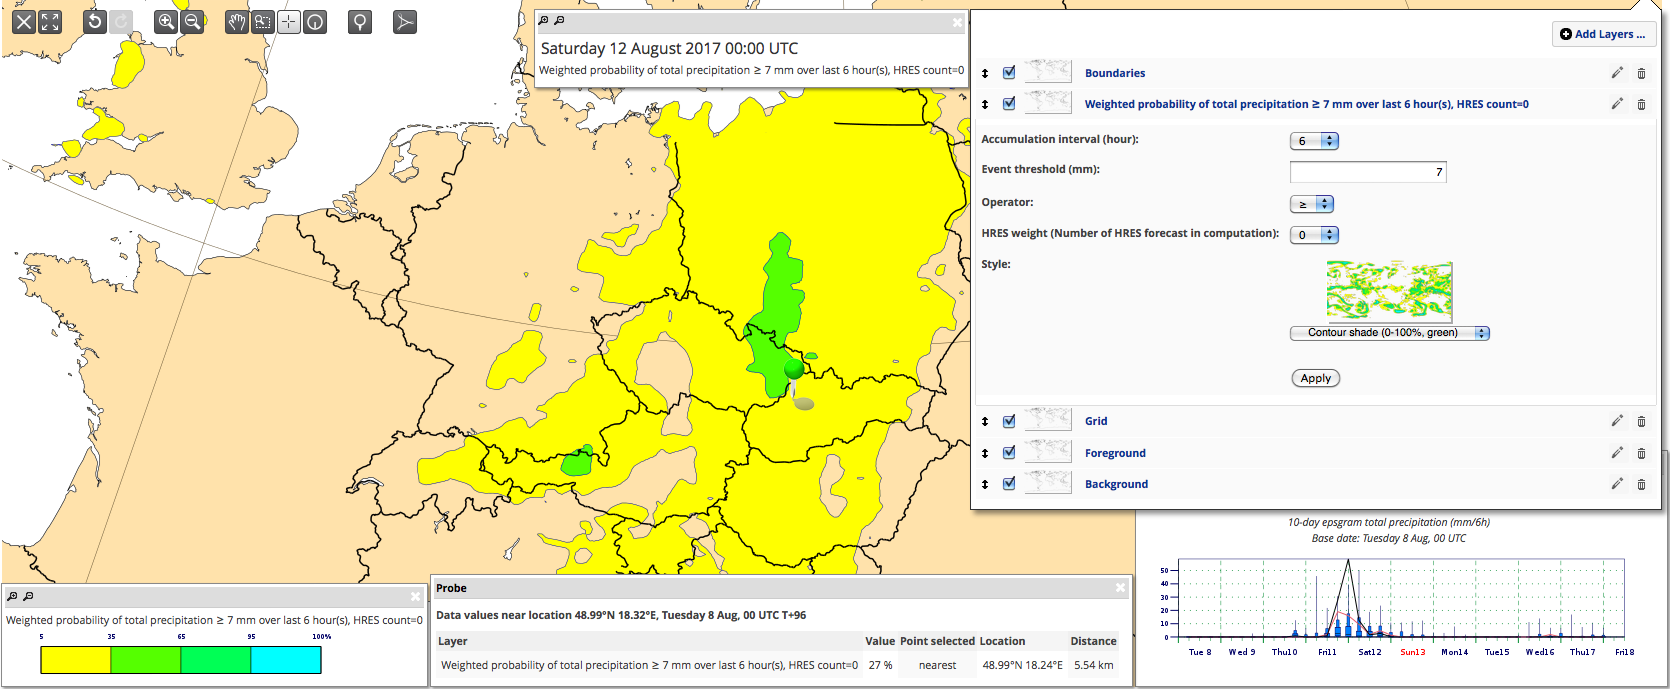
PNG File Fig12.2.2 HRES Weighting 10.png |
299 kB |
Bob Owens |
Aug 25, 2022 10:17 |
Aug 25, 2022 10:17 |
|
Page: Section 10.2 ecCharts
|
|
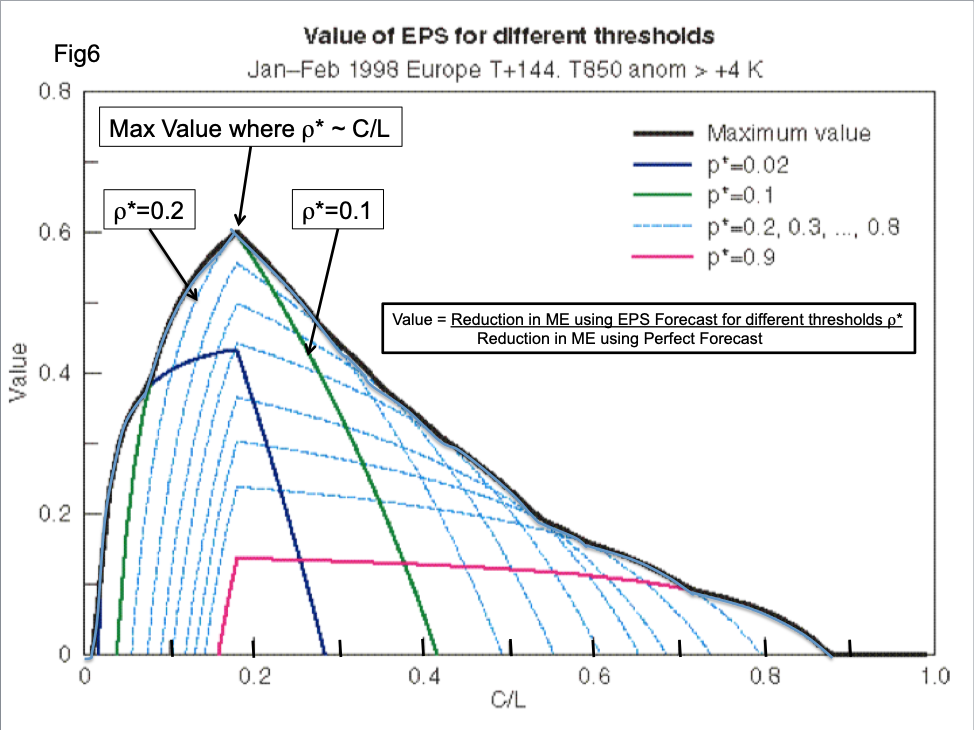
PNG File CostLossNo6.png |
299 kB |
Bob Owens |
Jul 06, 2023 09:24 |
Jul 06, 2023 09:24 |
|
Page: Section 12.B Statistical Concepts - Probabilistic Data
|
|
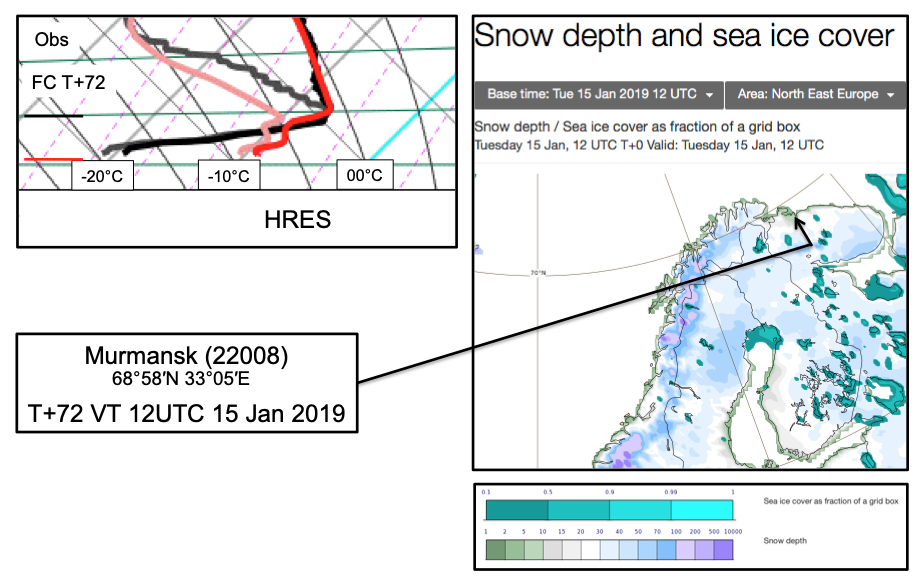
PNG File Fig Forecast Tephi and Snow Cover.png |
299 kB |
Bob Owens |
Aug 25, 2022 10:08 |
Aug 25, 2022 10:08 |
|
Page: Section 9.2.1 Causes of Errors in Forecast Temperature and Humidity
|
|
PNG File Fig12.2.1 HRES Weighting 0.png |
298 kB |
Bob Owens |
Aug 25, 2022 10:17 |
Aug 25, 2022 10:17 |
|
Page: Section 10.2 ecCharts
|
|
PNG File Screenshot 2024-01-01 at 15.59.17.png |
298 kB |
Bob Owens |
Jan 01, 2024 16:39 |
Jan 01, 2024 16:39 |
|
Page: Section 8.1.9.6 Forecasting Severe Convective Hazards
|
|
PNG File Screenshot 2024-02-19 at 13.33.11.png |
297 kB |
Bob Owens |
Feb 19, 2024 16:00 |
Feb 19, 2024 16:00 |
|
Page: Section 2.1.4.5 Modelling soil structure
|
|
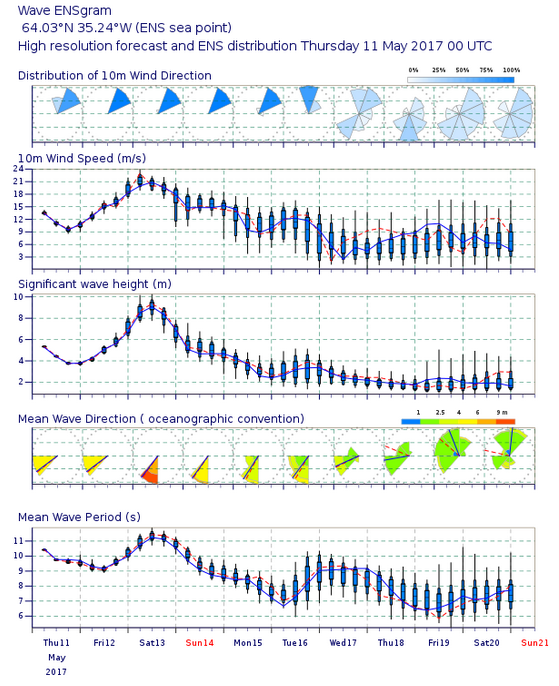
PNG File Fig631 Wavegram.png |
297 kB |
Bob Owens |
Aug 23, 2022 17:54 |
Aug 23, 2022 17:54 |
|
Page: Section 8.1.5 Waves and Wave Meteograms
|
|
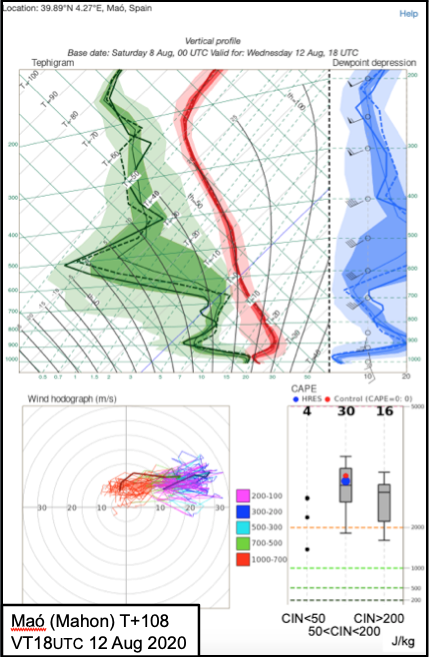
PNG File Tephi Mao 00Z280820.png |
294 kB |
Bob Owens |
Aug 23, 2022 18:08 |
Aug 23, 2022 18:08 |
|
Page: Section 8.1.8 Vertical Profiles
|
|
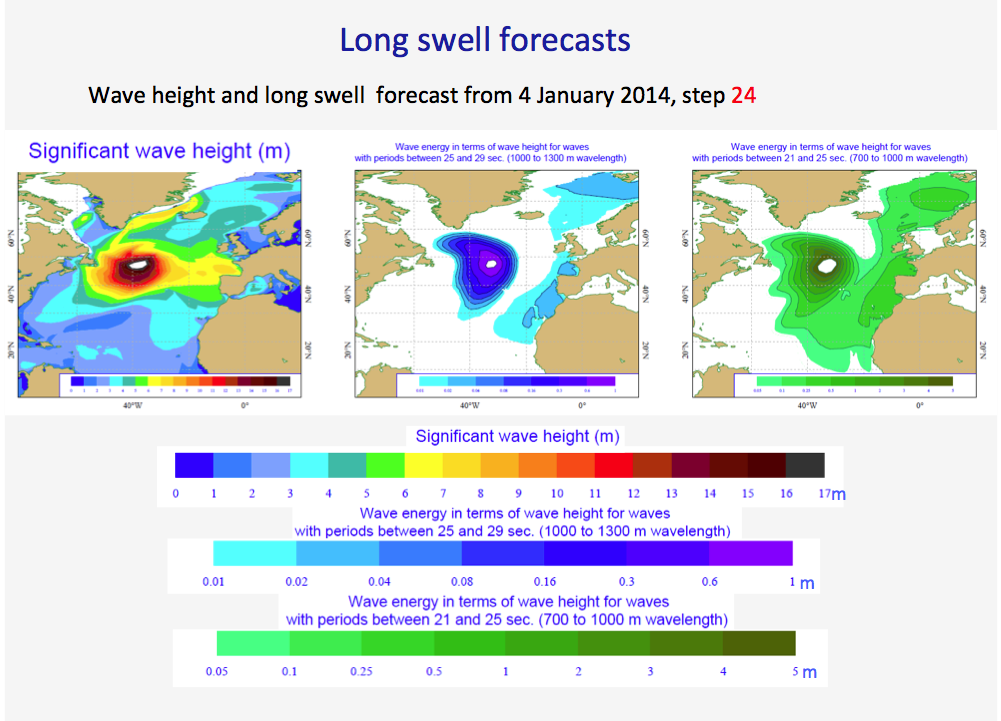
PNG File Wave Energy.png |
292 kB |
Bob Owens |
Aug 23, 2022 17:54 |
Aug 23, 2022 17:54 |
|
Page: Section 8.1.5 Waves and Wave Meteograms
|
|
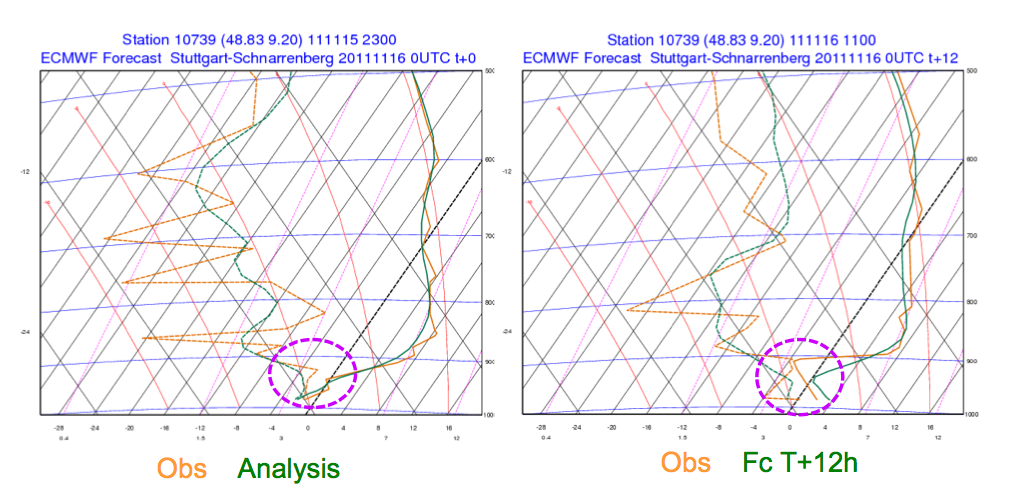
PNG File Boundary Layer Tephis.png |
292 kB |
Bob Owens |
Aug 25, 2022 10:07 |
Aug 25, 2022 10:07 |
|
Page: Section 9.1 Model Boundary and Surface Layers
|
|
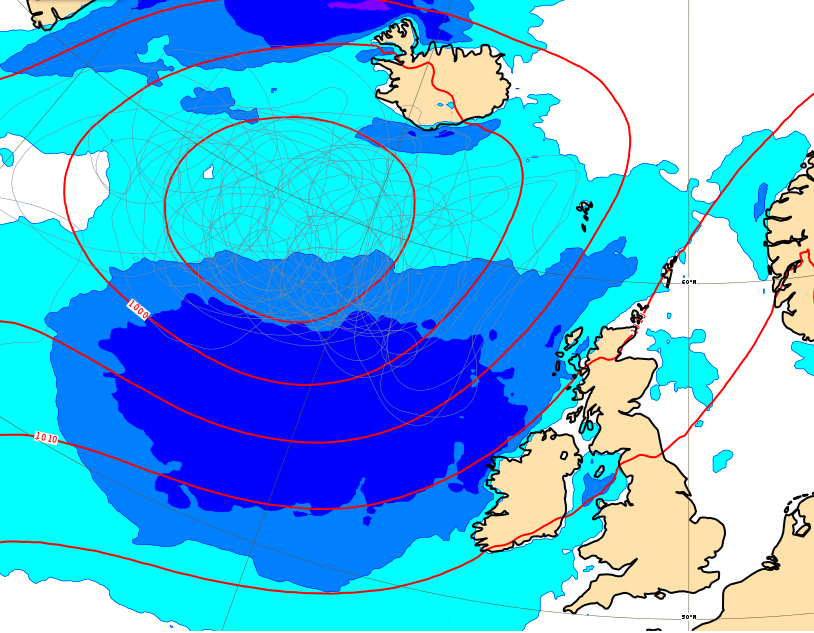
PNG File Fig7.1.7 Low NE Atl WindProb 00Z150617.png |
290 kB |
Bob Owens |
Aug 23, 2022 17:25 |
Aug 23, 2022 17:25 |
|
Page: Section 8.1.1 Basic ensemble products
|
|
PNG File FigRadiation Pic1.png |
290 kB |
Bob Owens |
Sept 06, 2022 21:05 |
Sept 06, 2022 21:05 |
|
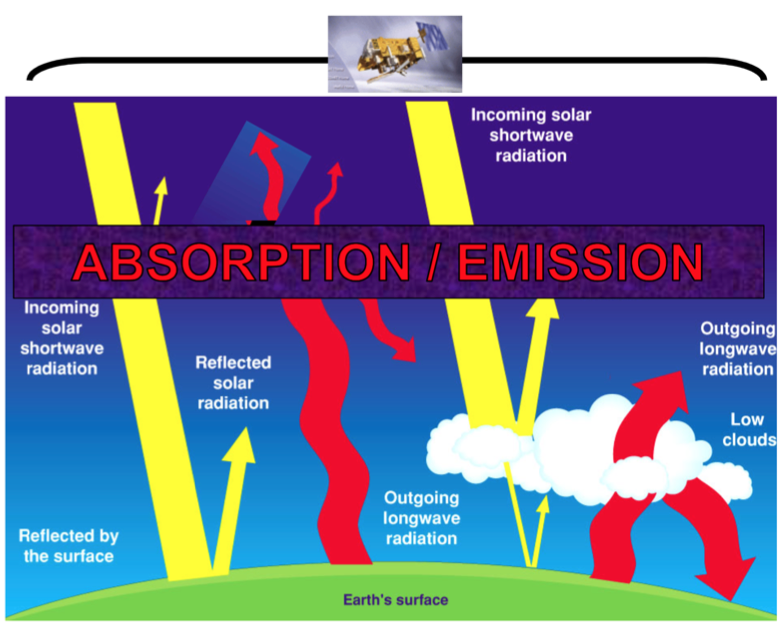
Page: Section 2.1.5.1 Radiation
|
|
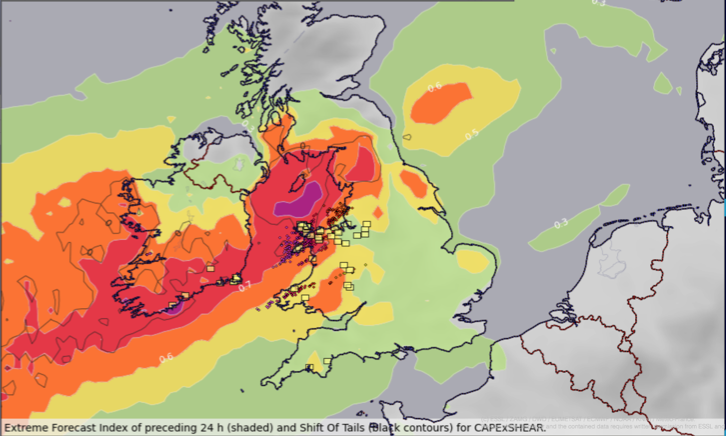
PNG File Fig2.2.8 EFI Waves.png |
288 kB |
Bob Owens |
Aug 23, 2022 16:42 |
Aug 23, 2022 16:42 |
|
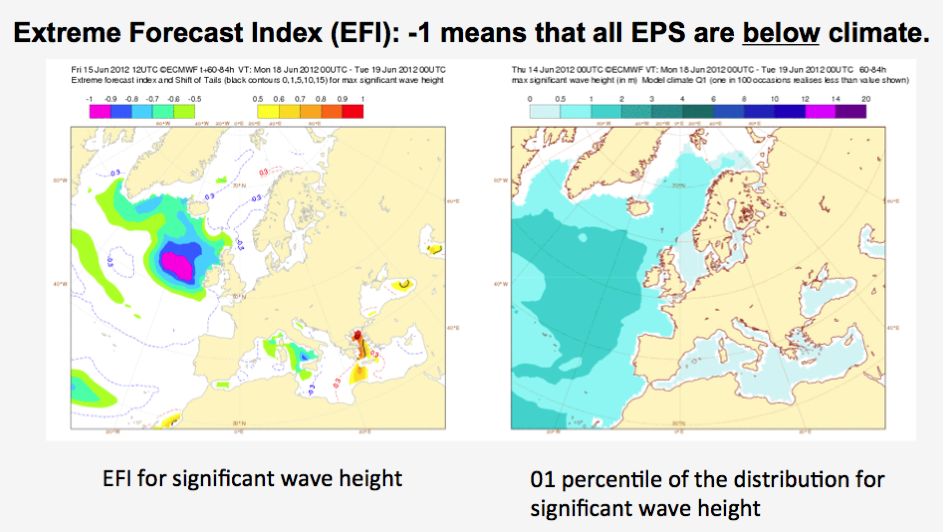
Page: Section 2.2 Ocean Wave Model - ECWAM
|
|
PNG File Fig2.2.7 EFI Waves.png |
288 kB |
Bob Owens |
Aug 23, 2022 16:43 |
Aug 23, 2022 16:43 |
|
Page: Section 2.2 Ocean Wave Model - ECWAM
|