You are viewing an old version of this page. View the current version.

Compare with Current View Page History

« Previous Version 5 Next »

Objectives


  • Set-up a cylindrical projection over the United States.
  • Apply land-shading on the coastlines.
  • Load a CSV file containing a possible trajectory of the storm
  • Apply a symbol plotting  to visualise this trajectory
  • Repeat for all the trajectories. 
  • Add a positional text

You will need to download


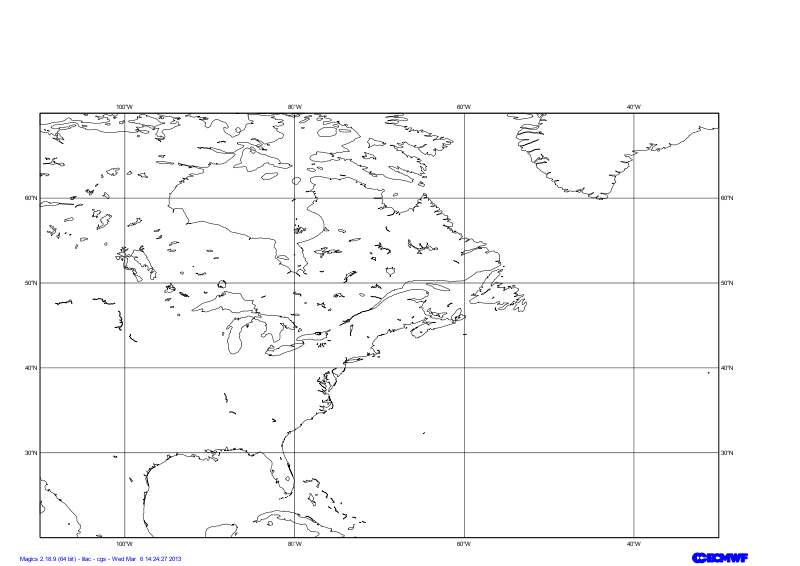
Setting of the geographical area

The Geographical area we want to work with today is defined by its lower-left corner [20oN, 110oE] and its upper-right corner [70oN, 30oE].

Have a look at the  subpage documentation to learn how to setup a projection .

Parameters to check


Useful subpage parameters

subpage_lower_left_longitude

subpage_lower_left_latitude
subpage_upper_right_longitude
subpage_upper_right_latitude
Python - Setting a projection
from Magics.macro import *
#setting the output 
output = output(    
                output_formats = ['png'],
                output_name = "map_step1",
                output_name_first_page_number = "off"
        )
#settings of the geographical area 
area = mmap(subpage_map_projection="cylindrical",
        subpage_lower_left_longitude=-110.,
        subpage_lower_left_latitude=20.,
        subpage_upper_right_longitude=-30.,
        subpage_upper_right_latitude=70.,
    )    
#Using a default coastlines to see the result
plot(output, area, mcoast())

Setting the coastlines

Until now you have used the mcoast to add coastlines to your plot. The mcoast object comes with a lot of parameters to allow you to style your coastlines layer.

The full list of parameters can be found in the Coastlines documentation.

In this first exercise, we will like to see:

  • The land coloured in cream.
  • The coastlines in grey.
  • The grid as a grey dash line.


Parameters to check


Useful Coastlines parameters

map_coastline_land_shade

map_coastline_land_shade_colour
map_coastline_colour
map_grid_colour
map_grid_line_style
Python - Coastlines
from Magics.macro import *
#setting the output 
output = output(    
                output_formats = ['png'],
                output_name = "map_step2",
                output_name_first_page_number = "off"
        )
#settings of the geographical area 
area = mmap(subpage_map_projection="cylindrical",
        subpage_lower_left_longitude=-110.,
        subpage_lower_left_latitude=20.,
        subpage_upper_right_longitude=-30.,
        subpage_upper_right_latitude=70.,
    )     
 #settings of the caostlines
coast = mcoast(map_coastline_land_shade = "on",
      map_coastline_land_shade_colour = "cream",
      map_grid_line_style = "dash",
      map_grid_colour = "grey",
      map_label = "on",
      map_coastline_colour = "grey")
plot(output, area, coast)


  • No labels