-
Created by
 Carsten Mass, last updated by Tim Hewson on Nov 04, 2025
12 minute read
Carsten Mass, last updated by Tim Hewson on Nov 04, 2025
12 minute read
IFS cycle 47r3 is delivering noteworthy changes in the characteristics of many of the forecast fields (such as precipitation) and forecast products regularly used by forecasters and others. These changes are probably more substantial, as a whole, than anything we have seen with any ECMWF cycle in the last 10 years. This page aims to highlight the key differences.
It is common forecaster practice to adjust for perceived/known biases or weaknesses in model behaviour, and given the new characteristics application of these ("old") corrections to output from the new cycle may no longer be appropriate. Some such corrections can be discarded or toned down; other new ones may need to be introduced.
Most of the changes with 47r3 are attributable to the new "Moist Physics" package, affecting cloud and precipitation in particular. However changes to the visibility and gust diagnostics will also have a substantial impact on occasion.
Impacts are listed below, by parameter, with examples generally comparing output from cycle 47r2 (operational until 12 October 2021) and contiguous non-operational runs of 47r3 (operational from 12 October 2021). Unless stated otherwise examples are from HRES. "NEW CYCLE" on plots below means 47r3.
Although ECMWF has used both systematic and case study analyses to document the most significant and substantial changes for users, the list below can not be considered exhaustive - other features may well come to light in the coming months.
Precipitation
A large set of cases in different "synoptic type" categories where precipitation tends to occur were examined; these included orographic rainfall (convective, large-scale, mix), cold fronts, warm fronts, diurnal convection over land, SST-triggered convection, tropical convection, MCSs (mesoscale convective systems). In almost all of these classes the precipitation rate patterns look to be systematically different in 47r3.
Precipitation Rates
The two examples below illustrate the key characteristics commonly seen.
|
|
|


- A: In 47r3 convection consistently exhibits a smaller areal coverage of wet (precipitating) pixels (as much as 50% less), but with higher peak rates (>2x more). Here we are dealing with marine convection, but this applies also to diurnal convection over land.
- B: In 47r3 precipitation rates tends to have higher peaks on fronts (up to about 2x more). Cold front line convection characteristics can be more apparent.
- C: In 47r3 the areal coverage of frontal (mainly large scale) precipitation is slightly smaller.
- D: The longstanding tendency of marine convection to erroneously stop at coastlines is similar in 47r3.
|
|

This second case (warm front over France) provides further evidence of aspect C, in common with more spatial fragmentation.
This case also shows a greater prevalence of isolated convective outbreaks (and associated higher rates) being embedded into frontal precipitation, but sometimes surrounded by dry pixels. In another case this behaviour was very pronounced - it looks somewhat unrealistic and was much less common in 47r2.
An additional characteristic not illustrated here is the over-active triggering of convective precipitation by mountains in onshore flow of unstable marine air. This pre-existing issue, whereby rainfall can be systematically over-forecast by more than a factor of 2, seems to have been made somewhat worse in 47r3.
Precipitation Totals
A comparison of Model Climate data for 47r2 and 47r3 (as derived from 20 years of ensemble re-forecasts) can give clear insights into the behaviour of both 'normal' rainfall events, and extremes (albeit that such data is only available for the 2 or 3 months leading up to cycle switchover). We see little change in 'normal' events, but some noteworthy changes in extremes, which themselves depend on location. These are illustrated on the plots below.
|
|
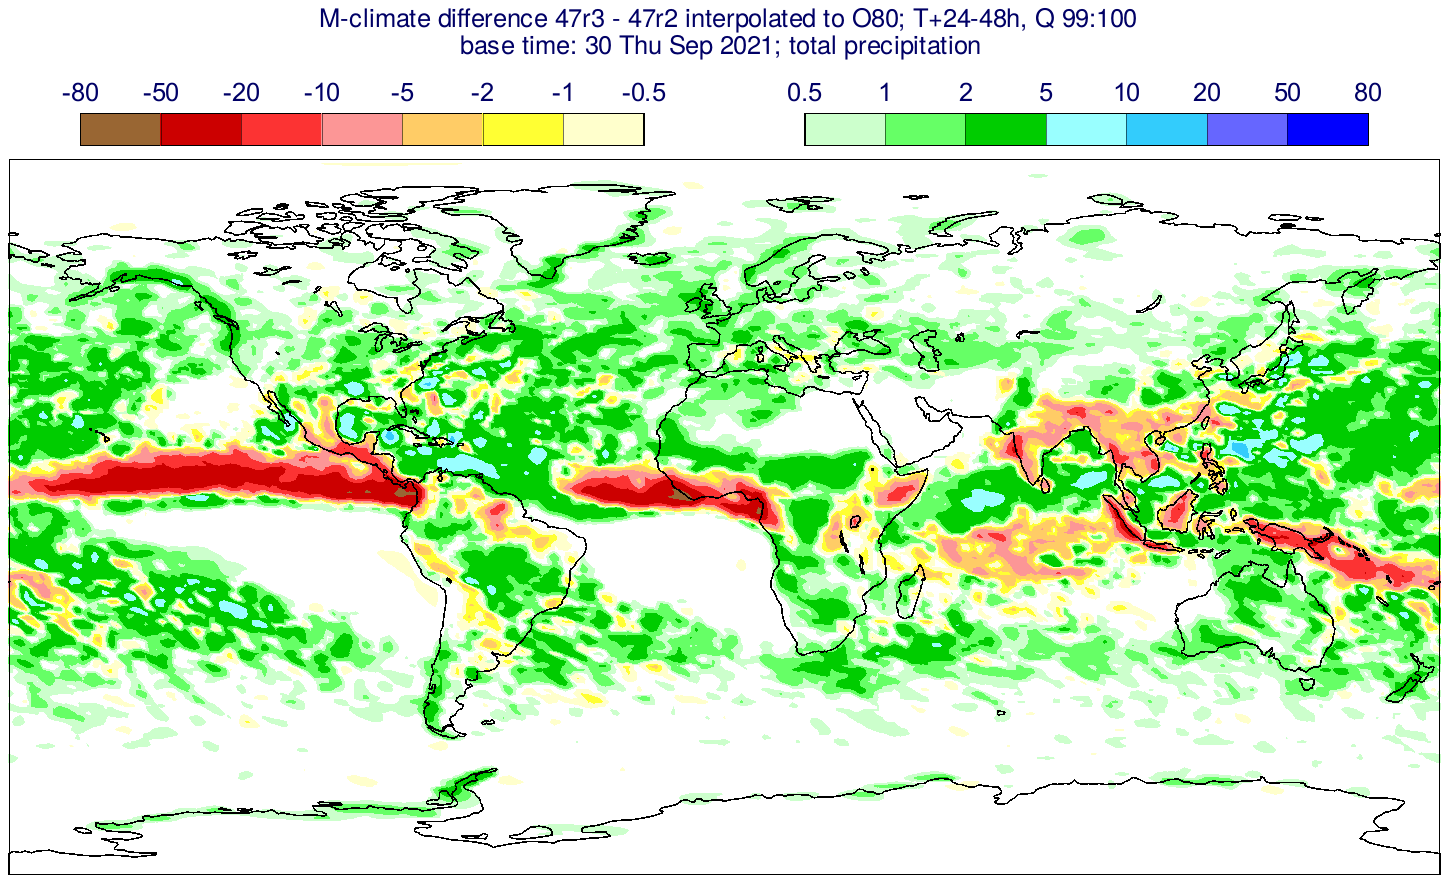
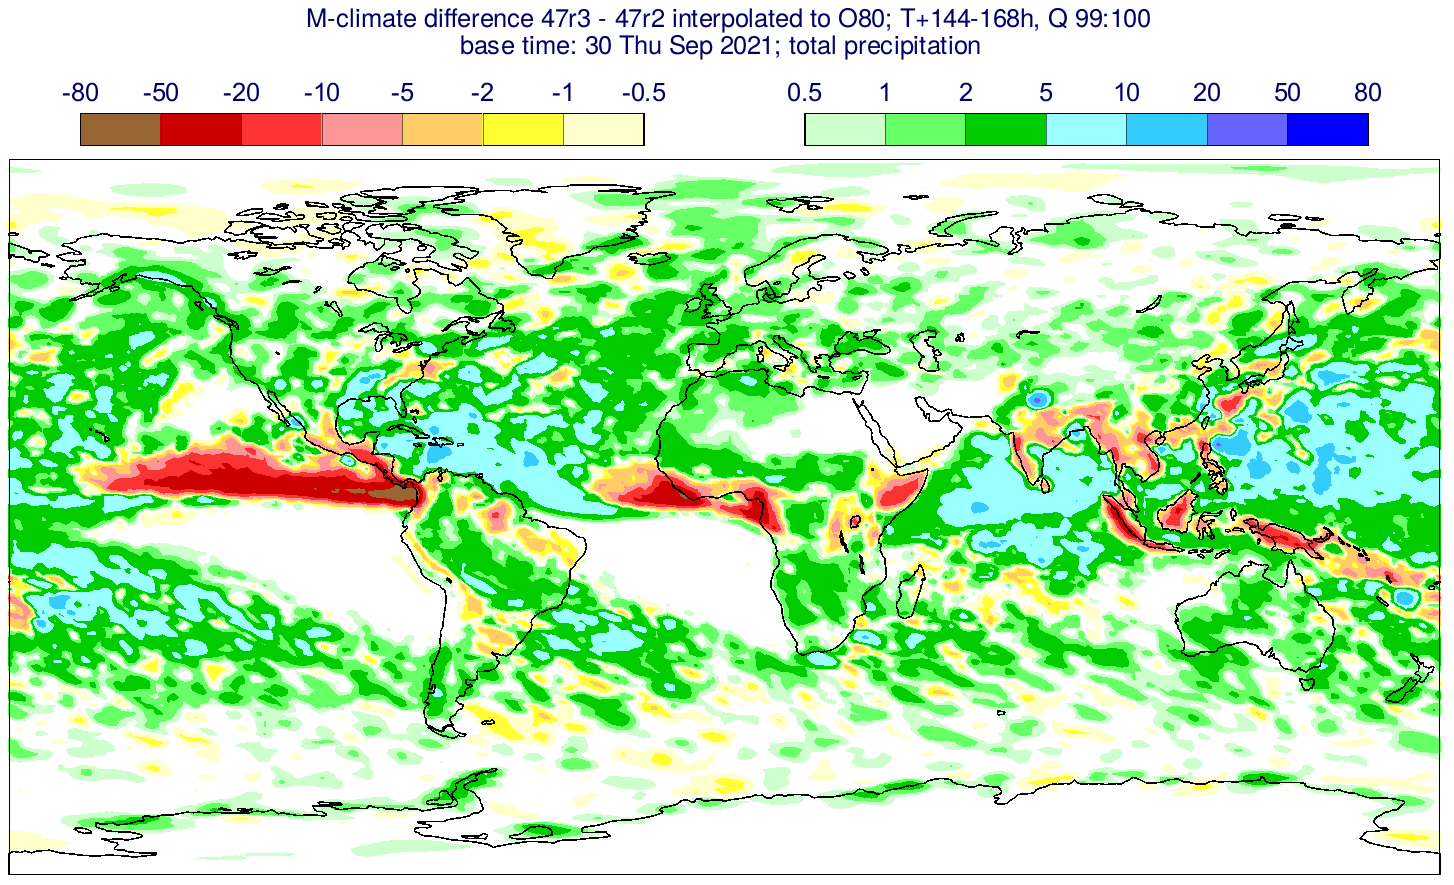
Plots show the day 2 (left) and day 7 (right) differences between the 99th percentile of the model climate for 24h rainfall, for 47r3 minus 47r2, in mm (with a smoothing mechanism applied).
- 1. Certain tropical areas have much smaller extremes in 47r3 (reds). This is considered an improvement whereby localised and unrealistic very extreme rainfall (so-called "rain bombs") seen in these areas in 47r2 are not present in 47r3.
- 2. In the extra-tropics (and some tropical and sub-tropical areas) extreme rainfall events tend to be slightly more extreme.
The changes are sufficiently large to be noticeable on "15-day Meteogram with model climate" products (e.g. for European sites). One can also see the impact on cyclone database products - specifically the dalmatian charts for the "Ppn max" cyclone attribute, as illustrated below. In checks there was no systematic impact on the "Ppn mean" attribute.

Note how the cyclonic features on the new cycle frame are overall associated with higher peaks of 12h precipitation in the vicinity.
The plots below show 6h precipitation, ending T+24 = 00UTC 4 June 2021, for the two cycles for a summer-time convective case over France, and are a nice example of the characteristics that we typically see in other convective cases: less areal coverage of rain and higher peaks (as was also noted above for instantaneous precipitation rates).

A careful study of over 100 MCSs (Mesoscale Convective Systems) over Europe during summer 2021 revealed that the new cycle performs slightly better in capturing these features. There has however been no clear evidence of improvement for particularly problematic MCS cases.
Orographic rainfall is handled slightly differently in cycle 47r3. One characteristic sometimes seen is a clearer distinction between rainfall in upslope regions and other areas. In the example below strong S to SE'ly low level flow prevailed. Note the slightly larger amplitude in the rainfall pattern - higher peaks and lower troughs - in the new cycle. However a distinction of this type is not apparent in all cases.
|
|


It is very difficult to properly verify the veracity or otherwise of all the precipitation-related changes we see in cycle 47r3. However the rate distributions do tend to look more realistic compared to radar data. We also know that where there is good data coverage (North America), the distribution of gridbox totals is more realistic in 47r3. At the same we have also seen, in global verification using ~5000 gauge observations daily over two winter months, that a small over-prediction bias already present in cycle 47r2 is slightly larger in 47r3. Verification scores can be found elsewhere.
Tropical Convection
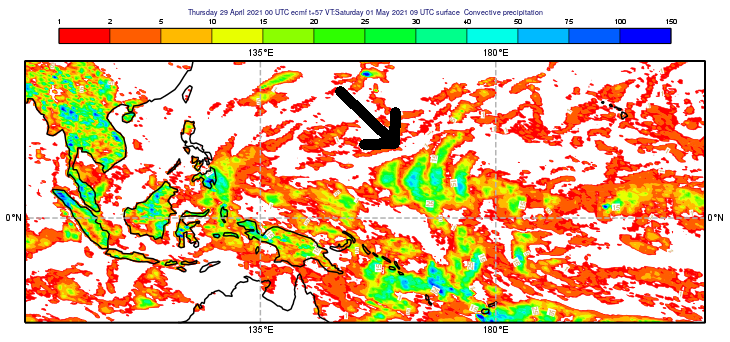
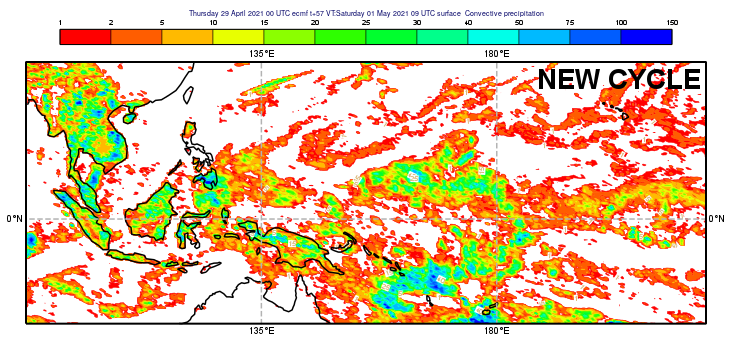
In cycles prior to 47r3 unrealistic precipitation patterns sometimes occurred in the tropics. In some regions 'rain bombs' (overly intense rainfall) occasionally developed (left panel just below). Sometimes these spawned spurious gravity waves - note the stone-in-a-pond effect - which themselves lead to unrealistic "squall-lines" in rainfall, propagating outwards in one or more directions. In turn these could lead to unrealistic banding in longer period rainfall totals (arrowed on middle panel below, which shows 57h rainfall but for a different case).
In cycle 47r3 we do not generally see these spurious features. The right panel is a new cycle equivalent of the middle panel - note that banding is absent.
|
|
|

In reality westward propagating squall lines occur with some regularity over central parts of Africa. As many as 50% of these can now be captured in short range forecasts in the new cycle, which is a marked improvement. The 3-panel example below shows animated hourly rainfall (red for > 13mm), from a satellite-derived analysis product on the left, the old cycle in the centre, and the new cycle on the right. Even if there is high uncertainty in rates due to lack of ground-based observations it is clear that the squall line feature is much better captured in the new cycle.
|
|
|


Cloud and Sunshine
Cycle 47r3 is more cloudy, generally, than was cycle 47r2. On standard products increases can be seen quite clearly in low cloud, in high cloud and in total cloud cover, around the world. Any systematic changes in medium cloud are not so perceptible.
|
|

These animations from ecCharts compare short range HRES forecasts of low cloud cover at an instant in time (left), and 24h sunshine totals (right), between the old and new cycles, at short lead times. In the majority of regions one sees that low cloud cover goes up slightly and sunshine goes down slightly in the new cycle.
Please note that the picture for sunshine is not reflected in forecasts of solar radiation at the surface, which in many regions exhibit higher values in 47r3 than in 47r2, due to a reduction in the liquid water path which tended to be too high in 47r2 for shallow convective clouds.
A more systematic long period analysis of cloud cover reveals the following features of 47r3 forecasts (relative to 47r2):
| Type | Tropics (30S - 30N) | Extra Tropics |
|---|---|---|
| Total cloud cover | Mixed picture but more overall (by 3%) | More (by 4%) |
| High cloud cover | More | Slightly more |
| Medium cloud cover | Slightly Less | Mixed picture |
| Low cloud cover | Very mixed picture | More |
"Mixed picture" means marked regional variations. The maximum change at any location in any of these classes is about 15%.
Regional average changes, over summer and winter seasons, at a 48-hour lead time, are illustrated on the following plot (warm colours mean more cloud in 47r3).

High cloud in particular tends to show more sharply defined edges in 47r3. The example below highlights far more areas of cloud cover >99% (i.e. >0.99), and similarly a much reduced spatial coverage of areas with 50-99% cover. It should be added that the non-opaque nature of high cloud makes defining full cover in a meaningful way rather difficult.

An upward shift in the total cloud cover climatology is also apparent on meteograms, as shown below.

This comparison is for Reading. Note how all the model climate cloud cover percentiles go up in the new cycle, most notably the 75th (top of the darkest purple band). In this case the forecasts (box and whiskers) are clearly also more cloudy overall; this is not because the forecast synoptic patterns are different.
Many examples of winter-time anticyclones over Europe were analysed to examine possible impacts on low cloud cover. Whilst there is case-to-case variability the differences in relatively short range forecasts were usually rather small, and neither cycle was clearly better overall.
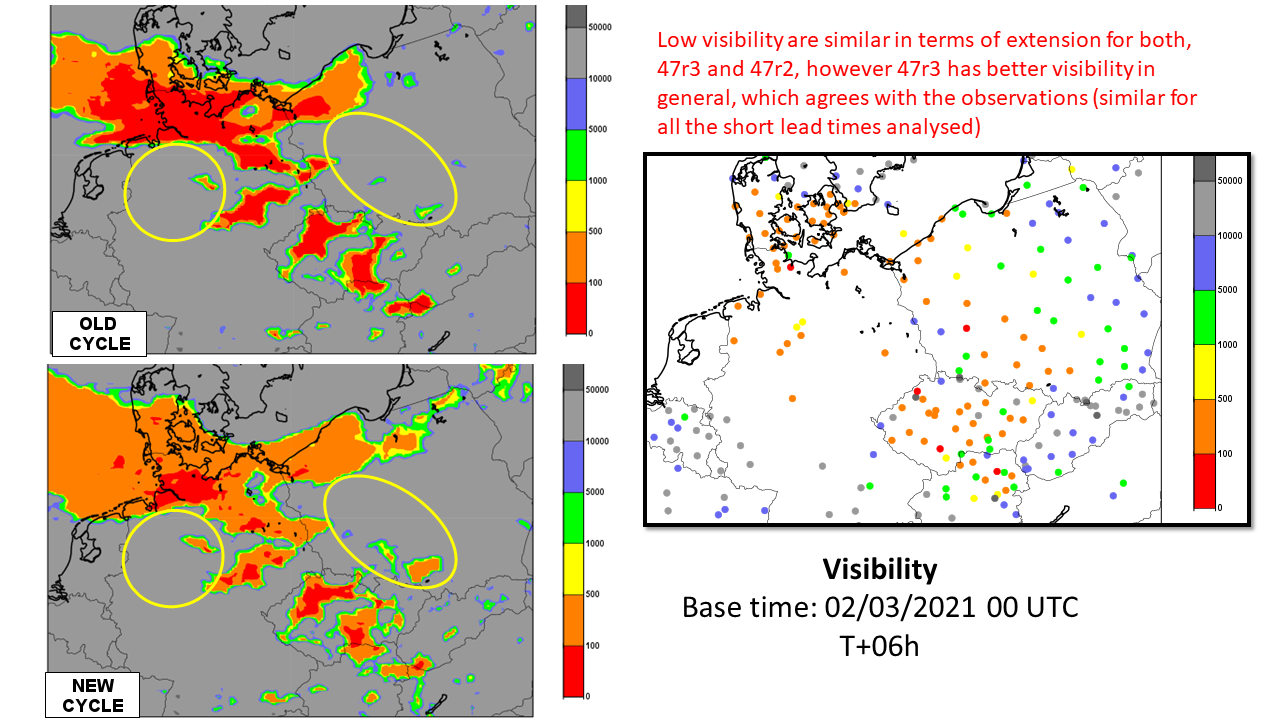
Visibility
There have been some major changes to the visibility parametrisation, with the following positive impacts:
- In 47r3 very low visibilities in fog (<100m) are much less frequent
- In 47r3 visibility in rain is substantially higher
- In 47r3 visibility in snow is substantially lower
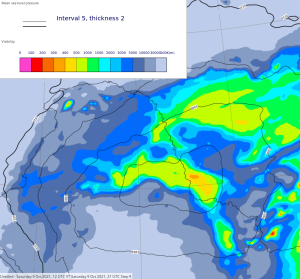
The next figures illustrates point 1 for a strong anticyclone in early March; note the smaller areal extent of red shading (visibility <100m), and how this agrees better with observations. Yellow rings highlight regions where the visibility is systematically much too high in both cycles - fog prediction remains a major challenge.
|
|

The plots below, from a day with heavy rain in NW Europe, nicely illustrate point 2 above (plots of rainfall rate with mslp are added in each case as a reference point). One can also see that any counteracting effect of the highest rainfall rates tending to be even higher in 47r3 is negligible by comparison.
|
|
|
|


The following panels compare visibility in an October case with snow and rain centred on northernmost China. Cycle 47r3 shows lower values overall in the snow than in the rain; this looks more realistic than 47r2 which has the opposite.
| Diagnosed Ppn type | Total Precipitation Rate | Total Snowfall Rate | Visibility | |
47r2 (old cycle) |
|
|
|
|
47r3 (new cycle) |
|
|
|
|


Wind gusts
The 10m wind gust parametrisation has been changed in two ways in cycle 47r3; the first change reduces the standard 'turbulent gusts' by 7%, the second change reduces the convective gust addition by 50% (whenever it is applied). The net result is slightly lower gusts overall, albeit with the size of the impact depending on the situation.

This short range forecast example from Feb 2020 shows a marked reduction in gusts over northwest Europe, bringing them more into line with observations (although the leftmost panel here shows cycle 46r1 - it was the operational cycle at the time - a rerun of 47r2 would have shown much the same).
Sometimes, for other reasons, gusts (and mean winds) can be higher in 47r3 than in 47r2, even when pressure gradients are almost identical. Such cases are in the minority however, as illustrated in the single-time comparison below.

Miscellaneous
Precipitation type products
Precipitation type products (in map and site-specific bar chart formats) are expected to show a reduced probability of precipitation falling at any given time, due to the change in spatial coverage of precipitation in cycle 47r3 noted above. The differences will be most apparent in summer, when convective rain, which exhibits the largest reduction in areal coverage, is more prevalent. Products in this class will thus have a "drier" look to them (although on bar charts a slight increase in higher rate probabilities is also expected). We may adjust the minimum rate thresholds used for these products at some future point, following more verification work; for the time being these thresholds remain the same.
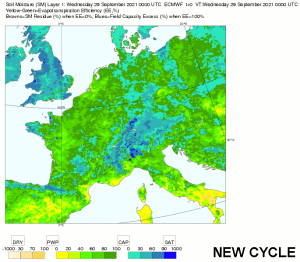
Soil Moisture
One knock-on effect of the structural changes to precipitation fields described in the section above is that soil moisture now exhibits more spatial variability, particularly for soil level 1 (corresponding to the top 7cm of soil). Note the increased 'noise' on the new cycle plot below. There may be some direct impact on surface weather parameters although this has not been studied directly.
|
|