![]() mcont ( macro/python ) pcont ( fortran )
mcont ( macro/python ) pcont ( fortran )
Contouring is achieved by calling the action routine pcont, i.e. call pcont . The call may be preceded by one or more calls to Magics parameter setting routines. pcont will only take into account those parameters set before the routine is called. Any calls to Magics parameter setting routines after pcont is called are only relevant to future action routines.
When the action routine pcont is called, it will plot contours based on the input data supplied and according to the user's instructions. The input data may have different organizations: GRIB code data, regular latitude/longitude grid, gaussian grid. Before pcont is called, the user must define how he wants the data to be contoured, i.e. location of the data, dimensions of the array, input field organization etc. This is done by calling Magics parameter setting routines. Data may be passed in an array, in GRIB or NetCDF format
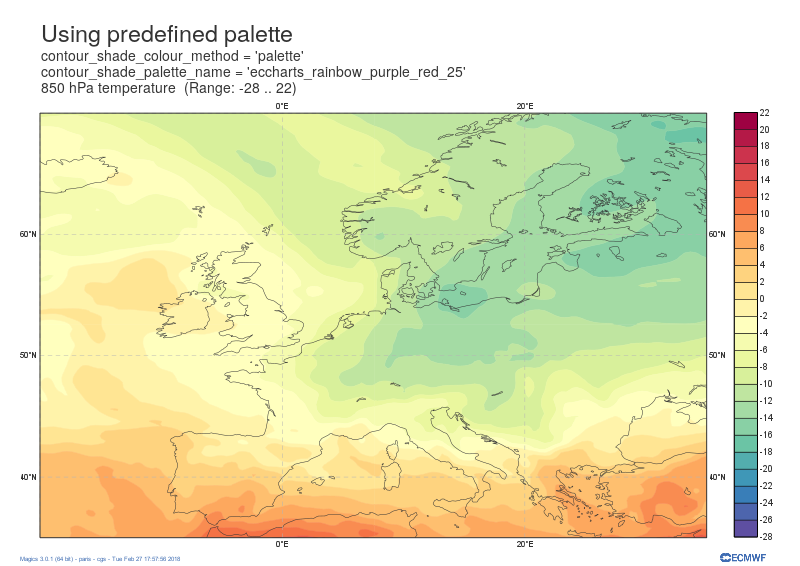
From Magics 2.0.1, Magics offers the ability of using a large variety of predefined palettes .
Have a look at the already defined palettes and do not hesitate to send us your favourites ones, we will integrate them .
#Defining the contour
contour = mcont(
    contour = 'off',
    contour_hilo = 'off',
    contour_interval = 2.0,
    contour_label = 'off',
    contour_level_selection_type = 'interval',
    contour_shade = 'on',
    contour_shade_palette_name = 'eccharts_rainbow_purple_red_25',
    contour_shade_colour_method = 'palette',
    contour_shade_max_level = 22.0,
    contour_shade_method = 'area_fill',
    contour_shade_min_level = -28.0,
    legend = 'on'
)
| cont | description | default | Your Selection | |
|---|---|---|---|---|
| This controls the plotting of isolines, contour bands and grid points.[version 3.1.0] | ||||
| legend | Turn legend on or off | off | ||
| contour | Turn contouring on or off | on | ||
| contour_line_style | Certain parameters will be scaled into more user-friendly units if the data has not been manipulated Certain parameters will be scaled into more user-friendly units if the data has been manipulated Style of contour line | solid | ||
| contour_line_thickness | Thickness of contour line | 1 | ||
| contour_line_colour_rainbow | if On, rainbow colouring method will be used. | off | ||
| contour_line_colour | Colour of contour line | press to change colourMore on colours... | blue | |
| contour_line_colour_rainbow_method | Method of generating the colours for isoline | calculate | ||
| contour_line_colour_rainbow_max_level_colour | Colour to be used for the max level | press to change colourMore on colours... | blue | |
| contour_line_colour_rainbow_min_level_colour | Colour to be used for the mainlevel | press to change colourMore on colours... | red | |
| contour_line_colour_rainbow_direction | Direction of colour sequencing for colouring | anti_clockwise | ||
| contour_line_colour_rainbow_colour_list | List of colours to be used in rainbow isolines | Enter a list of strings: val1/val2/val3 | stringarray() | |
| contour_line_colour_rainbow_colour_list_policy | What to do if the list of colours is smaller that the list of contour: lastone/cycle | lastone | ||
| contour_line_thickness_rainbow_list | List of thickness to used when rainbow method is on | intarray() | ||
| contour_line_thickness_rainbow_list_policy | What to do if the list of thickness is smaller that the list of contour: lastone/cycle | lastone | ||
| contour_line_style_rainbow_list | List of line style to used when rainbow method is on | Enter a list of strings: val1/val2/val3 | stringarray() | |
| contour_line_style_rainbow_list_policy | What to do if the list of line styles is smaller that the list of contour: lastone/cycle | lastone | ||
| contour_highlight | Plot contour highlights (ON/OFF) | on | ||
| contour_highlight_style | Style of highlighting (SOLID/ DASH/ DOT/ CHAIN_DASH/ CHAIN_DOT) | solid | ||
| contour_reference_level | Contour level reference | 0.0 | ||
| contour_highlight_colour | Colour of highlight line | press to change colourMore on colours... | blue | |
| contour_highlight_thickness | Thickness of highlight line | 3 | ||
| contour_highlight_frequency | Frequency of highlight line | 4 | ||
| contour_level_selection_type | count: calculate a reasonable contour interval taking into account the min/max and the requested number of isolines. interval: regularly spaced intervals using the reference_level as base.level_list: uses the given list of levels. | count | ||
| contour_max_level | Highest level for contours to be drawn | 1.0e+21 | ||
| contour_min_level | Lowest level for contours to be drawn | -1.0e+21 | ||
| contour_shade_max_level | Highest level for contours to be shaded | 1.0e+21 | ||
| contour_shade_min_level | Lowest level for contours to be shaded | -1.0e+21 | ||
| contour_level_count | Count or number of levels to be plotted. Magics will try to find "nice levels", this means that the number of levels could be slightly different from the asked number of levels | 10 | ||
| contour_level_tolerance | Tolerance: Do not use nice levels if the number of levels is really to different [count +/- tolerance] | 2 | ||
| contour_interval | Interval in data units between two contour lines | 8.0 | ||
| contour_level_list | List of contour levels to be plotted | Enter a list of float: 4.5/5./1. | floatarray() | |
| contour_label | Plot labels on contour lines | on | ||
| contour_label_type | Type of label (TEXT/NUMBER/BOTH) | number | ||
| contour_label_text | Text for labels | |||
| contour_label_height | Height of contour labels | 0.3 | ||
| contour_label_format | Format of contour labels (MAGICS Format/(AUTOMATIC)) | (automatic) | ||
| contour_label_blanking | Label Blanking | on | ||
| contour_label_quality | (LOW/MEDIUM/HIGH) | low | ||
| contour_label_font | Name of the font | sansserif | ||
| contour_label_font_style | Style of the font bold/italic | normal | ||
| contour_label_colour | Colour of contour labels | contour_line_colour | ||
| contour_label_frequency | Every Nth contour line is labelled | 2 | ||
| contour_shade | Turn shading on | off | ||
| contour_shade_technique | Technique used for shading (POLYGON_SHADING/ CELL_SHADING/ MARKER) | polygon_shading | ||
| contour_shade_method | Method used for shading (DOT/ AREA_FILL/ HATCH) | dot | ||
| contour_shade_dot_size | Size of dot in shading pattern | 0.02 | ||
| contour_shade_max_level_density | Dots/square centimetre in highest shading band | 50.0 | ||
| contour_shade_min_level_density | Dots/square centimetre in lowest shading band | 1.0 | ||
| contour_shade_hatch_index | The hatching pattern(s) to use. 0 Provides an automatic sequence of patterns, other values set a constant pattern across all contour bands. | 0 | ||
| contour_shade_hatch_thickness | Thickness of hatch lines | 1 | ||
| contour_shade_hatch_density | Number of hatch lines per cm. | 18.0 | ||
| contour_grid_shading_position | Middle : the point is in the midlle of the cell, bottom_left : the point is in the bottom left corner | middle | ||
| contour_shade_cell_resolution | Number of cells per cm for CELL shading | 10 | ||
| contour_shade_cell_method | NMethod of determining the colour of a cell (INTERPOLATE/ NEAREST) | nearest | ||
| contour_shade_cell_resolution_method | if adaptive, magics will switch to grid_shading when the data resolution is greater that the requested resolution | classic | ||
| contour_shade_colour_table | Colour table to be used with MARKER shading technique | Enter a list of strings: val1/val2/val3 | stringarray() | |
| contour_shade_height_table | Height table to be used with MARKER shading technique | Enter a list of float: 4.5/5./1. | floatarray() | |
| contour_shade_marker_table_type | index: using contour_shade_marker_table and definiing the markers by index, name: using contour_shade_marker_name_table and defining the symbols by their names | index | ||
| contour_shade_marker_table | Marker table to be used with MARKER shading technique | Enter a list of integer: 5/9/12 | intarray() | |
| contour_shade_marker_name_table | Marker name table to be used with MARKER shading technique | Enter a list of strings: val1/val2/val3 | stringarray() | |
| contour_shade_colour_method | Method of generating the colours of the bands in contour shading (list/calculate/advanced) | calculate | ||
| contour_shade_max_level_colour | Highest shading band colour | press to change colourMore on colours... | blue | |
| contour_shade_min_level_colour | Lowest shading band colour | press to change colourMore on colours... | red | |
| contour_shade_colour_direction | Direction of colour sequencing for shading (CLOCKWISE/ ANTI_CLOCKWISE) | anti_clockwise | ||
| contour_shade_colour_list | List of colours to be used in contour shading. | Enter a list of strings: val1/val2/val3 | stringarray() | |
| contour_shade_palette_name | Colour used at the stops : the gradeint will be calculated between 2 consecutive ones. | Find about the available palettes ... | ||
| contour_shade_palette_policy | What to do if the list of colours is smaller that the list of levels: lastone/cycle | lastone | ||
| contour_legend_only | Inform the contour object do generate only the legend and not the plot! | off | ||
| contour_method | Contouring method | automatic | ||
| contour_akima_x_resolution | X resolution of Akima interpolation | 1.5 | ||
| contour_akima_y_resolution | Y resolution of Akima interpolation | 1.5 | ||
| contour_interpolation_floor | Any value below this floor will be forced to the floor value.avoid the bubbles artificially created by the interpolation method | -INT_MAX | ||
| contour_interpolation_ceiling | any value above this ceiling will be forced to the ceiling value.avoid the bubbles artificially created by the interpolation method | INT_MAX | ||
| contour_automatic_setting | Turn the automatic setting of contouring attributes | off | ||
| contour_hilo | Plot local maxima/minima | off | ||
| contour_hilo_type | Type of high/low (TEXT/NUMBER/BOTH) | text | ||
| contour_hilo_height | Added for backwards compatibility with existing Metview Contour icons/macros Height of local maxima/minima text or numbers | 0.4 | ||
| contour_hilo_quality | (LOW/MEDIUM/HIGH) | low | ||
| contour_hi_colour | Colour of local maxima text or number | press to change colourMore on colours... | blue | |
| contour_lo_colour | Colour of local minima text or number | press to change colourMore on colours... | blue | |
| contour_hilo_format | Format of HILO numbers (MAGICS Format/(AUTOMATIC)) | (automatic) | ||
| contour_hi_text | Text to represent local maxima | H | ||
| contour_lo_text | Text to represent local minima | L | ||
| contour_hilo_blanking | Blank around highs and lows (ON/OFF) | off | ||
| contour_hilo_window_size | Size of the window used to calculate the Hi/Lo | 3 | ||
| contour_hilo_reduction_radius | Search radius (in grid points) for reducing the number of minima | 0.0 | ||
| contour_hilo_suppress_radius | Radius of HiLo search in grid points (default value is for global cylindrical map) | 15.0 | ||
| contour_hilo_max_value | Local HiLo above specified value are not drawn | 1.0e+21 | ||
| contour_hilo_min_value | Local HiLo below specified value are not drawn | -1.0e+21 | ||
| contour_hi_max_value | Local HI above specified value are not drawn | 1.0e+21 | ||
| contour_hi_min_value | Local HI below specified value are not drawn | -1.0e+21 | ||
| contour_lo_max_value | Local Lo above specified value are not drawn | 1.0e+21 | ||
| contour_lo_min_value | Local Lo below specified value are not drawn | -1.0e+21 | ||
| contour_hilo_marker | Plot hilo marker (ON/OFF) | off | ||
| contour_hilo_marker_height | Height of HILO marker symbol | 0.1 | ||
| contour_hilo_marker_index | Table number of marker symbol. See chapter on Plotting Attributes | 3 | ||
| contour_hilo_marker_colour | Colour of grid point markers(Full choice of colours) | press to change colourMore on colours... | red | |
| contour_grid_value_plot | Plot Grid point values | off | ||
| contour_grid_value_type | For Gaussian fields, plot normal (regular) values or reduced grid values. (NORMAL/REDUCED/akima). If akima, the akima grid values will be plotted | normal | ||
| contour_grid_value_plot_type | (VALUE/MARKER/BOTH) | value | ||
| contour_grid_value_min | The minimum value for which grid point values are to be plotted | -1.0e+21 | ||
| contour_grid_value_max | The maximum value for which grid point values are to be plotted | 1.0e+21 | ||
| contour_grid_value_lat_frequency | The grid point values in every Nth latitude row are plotted | 1 | ||
| contour_grid_value_lon_frequency | The grid point values in every Nth longitude column are plotted | 1 | ||
| contour_grid_value_height | Height of grid point values | 0.25 | ||
| contour_grid_value_colour | Colour of grid point values (Full choice of colours) | press to change colourMore on colours... | blue | |
| contour_grid_value_format | Format of grid point values (MAGICS Format/(AUTOMATIC)) | (automatic) | ||
| contour_grid_value_quality | (LOW/MEDIUM/HIGH) | low | ||
| contour_grid_value_justification | (LEFT/CENTRE/RIGHT) | centre | ||
| contour_grid_value_vertical_align | (NORMAL/TOP/CAP/HALF/BASE/BOTTOM) | base | ||
| contour_grid_value_marker_height | Height of grid point markers | 0.25 | ||
| contour_grid_value_marker_colour | Colour of grid point markers (Full choice of colours) | press to change colourMore on colours... | red | |
| contour_grid_value_marker_qual | (LOW/MEDIUM/HIGH) | low | ||
| contour_grid_value_marker_index | Table number of marker index. See Appendix for Plotting Attributes | 3 | ||
| contour_grid_value_position | Position of the value | top | ||
This version comes with a more complete implementation of the gradients colour setting.
This method can be used to create a list of colours giving a smooth transition between 2 colours.
The main control parameters of this new technique are shown in this small example.
contour_level_list = [-15,-0.5, 0.5,15]
contour_shade_colour_method = "gradients",
contour_gradients_colour_list = ['blue','white', 'red'],
contour_gradients_step_list = [50, 1, 50]
This setting will create the following list of colours : 50 colours between -15 and -0.5, 1 between -0.5 and 05 and 50 between 0.5 and 50.
![]()

New in 2.20
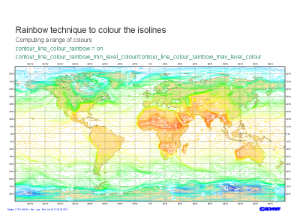
A contour_line_colour_rainbow parameter has been introduced, allowing the user to specify a different colour for each isoline.There are 2 ways to specify the list of colours to use, the setting being very similar of the colour settings for shading, ie: define the list, or let Magics computes the list given a max and min colour.
|
contour_line_colour_rainbow mcont(contour_level_selection_type = "interval", contour_line_colour_rainbow_max_level_colour = "red", contour_line_colour_rainbow = "on", contour_highlight = "off", contour_line_colour_rainbow_direction = "clockwise", contour_line_colour_rainbow_min_level_colour = "blue", contour_line_colour_rainbow_method = "calculate", contour_interval = 1.00) |
|---|
A contour_automatic_setting parameter has also been introduced, if set to ecchart, Magics will try to match the parameter with one of the predefined ecChart style. In one is found all the other contour parameters setiings will be ignored.
|
contour_automatic_setting mcont(contour_automatic_setting = "ecchart") |
|---|

9 Comments
Martin Janousek
I believe contour_hilo_height key is missing in this documentation page.
Dominique Lucas
Where can I find which markers correspond to the different indices for contour_grid_value_marker_index? The metview doc also refers to this page.
Sylvie Lamy-Thepaut
The naming convention for marker is the same than for symbol plotting . The list of symbols can be found in the Symbol Documentation.
Dominique Lucas
Thanks. When trying the link, I get back to the confluence 'dashboard', not to the expected page?
Sylvie Lamy-Thepaut
Sorry, I typed it wrong .. must be better now
Dominique Lucas
Merci!
Nicole Girardot
Does the option contour_hilo_plot_value still exist ?
Nicole.
Sylvie Lamy-Thepaut
I am not sure that contour_hilo_plot_value was an option in magics6, but I think..
contour_hilo = 'on
contour_hilo_type = 'number'
.. Should do what you want..
Happy new Year!
Sylvie
Remy Lee-Ah-Siem
I try to use "contour_hilo_position_file_name" to obtain a file (geopoint) with high or low positions, value in a file. Thanks