...
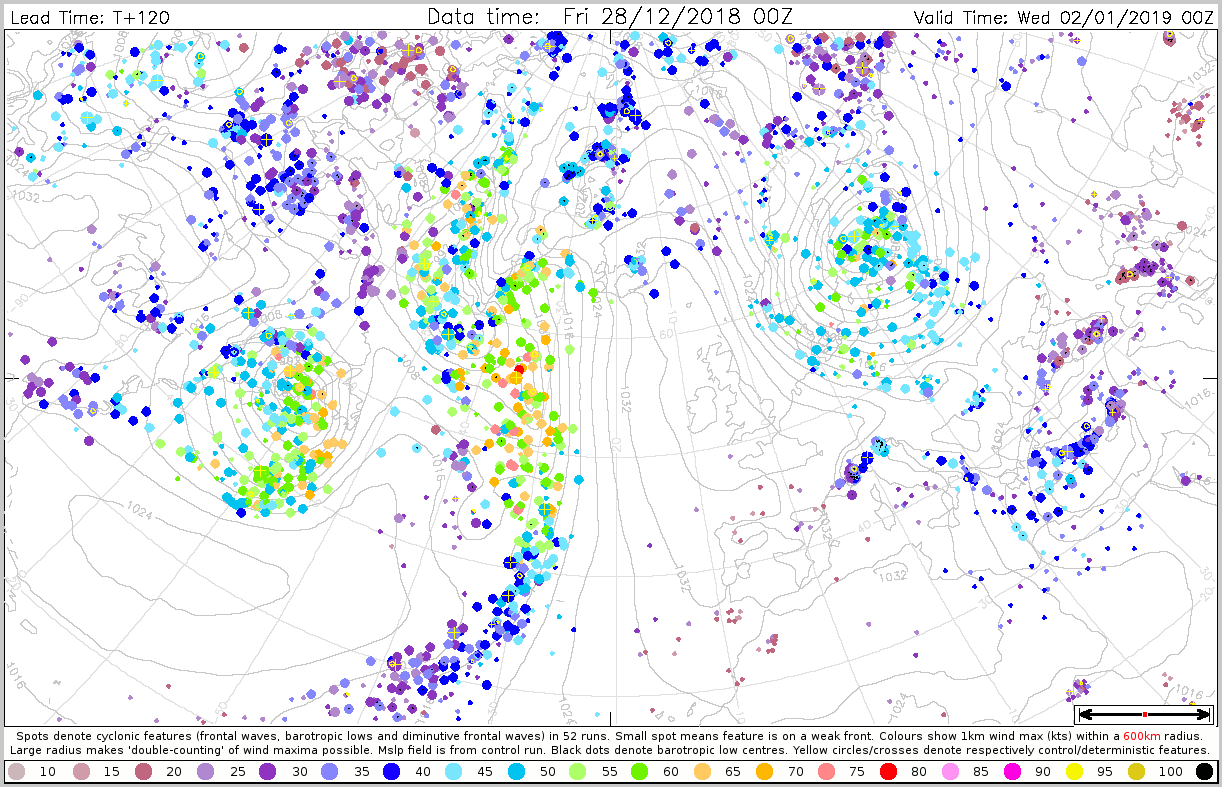
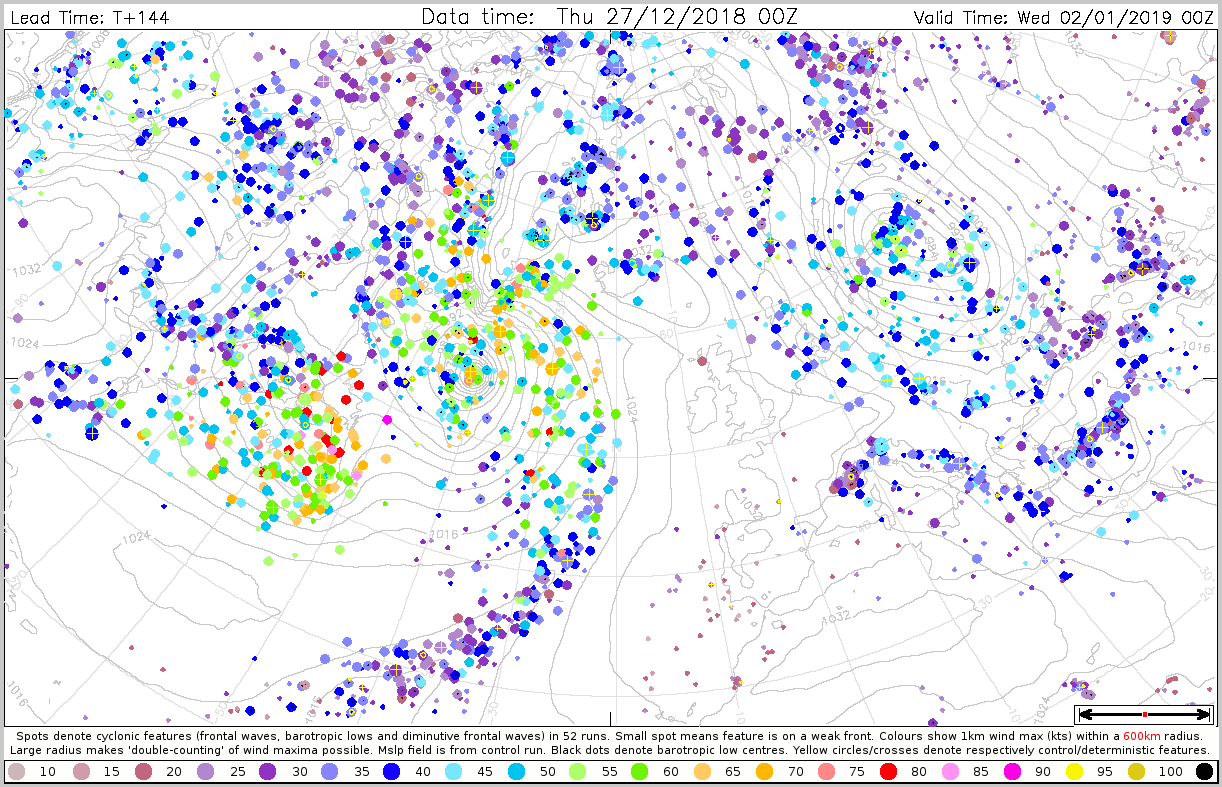
The plots below show cyclone feature plots valid 2 January 00UTC and where the colour represents the maximum wind within a 600 km radius.


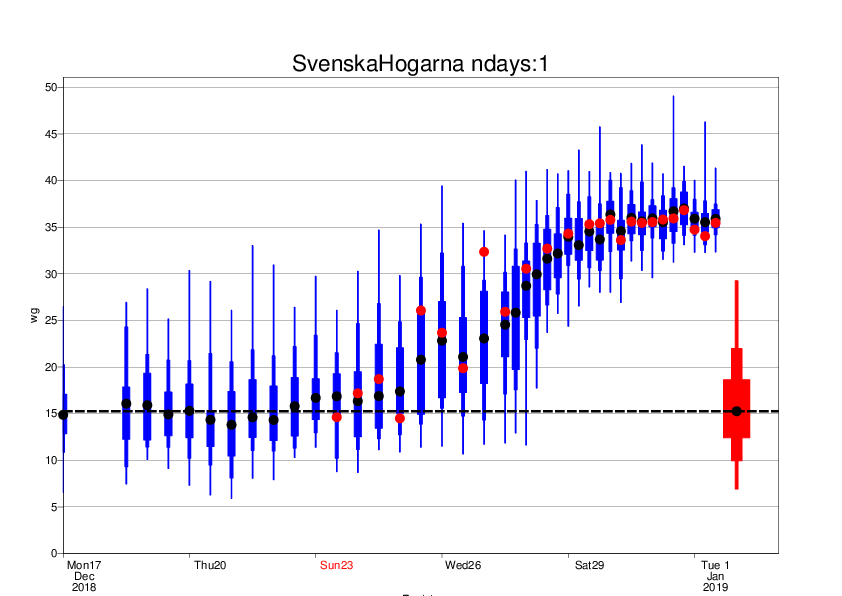
The plot below shows the evolution of forecast for 24-hour maximum wind gusts (1 January 12UTC to 2 January 12UTC) for Svenska Hogarna (59.5N, 19,5N), where the maximum gusts reached 37.2 m/s. The plot includes ensemble (blue box-and-whisker), HRES (red dot) and model climate (red box-and-whisker). From 28 December 06UTC and onwards the ensemble median was above the 99th percentile of the model climate. Note that in the forecast from 31 December 12UTC one ensemble member (number 22) reached almost 50 m/s.
3.4 Monthly forecasts
3.5 Comparison with other centres
...