...
http://intra.ecmwf.int/daily/d/dreport/2013/11/07/sc/

1. Impact
Super-typhoon Haiyan was the third category 5 typhoon to hit the Philippines since 2010. In 2010, Megi made landfall and resulted in 35 people dead and in 2012 Bupha resulted in 1901 dead. The tropical storm seasons in the north-western Pacific is one of the most active and Haiyan was cyclone number 3? and the fifth to made landfall on the Philippines (together with Rumbia, Nari, Utor and Krosa).
...
From www.wunderground.com
3. Predictability
3.1 Data assimilation

The figure above shows forecasts of the minimum pressure from long-window 4dvar forecasts, initialised every 12 hour (6 and 18 UTC). In black the estimated (for the hurricane centre at JMA) minimum pressure is plotted. The 12-hour forecast is used as first guess for the next analysis. Especially for the analysis of 7 Nov 18 UTC, the minimum pressure in the analysis is much higher than in the first guess, although the estimate is much lower. The problem here could be that the increments in the data-assimilation is much more large scale that this feature.

This figure shows the same as the previous one but for the e-suite. One difference in the e-suite is the flow-dependent length scale of increments. However, for this case we do not see any big impact of the change.


The figures above shows the MSLP of the first guess and analysis for 7 Nov 18 UTC. This confirms that the cyclone is much more shallow in the analysis.
3.2 HRES
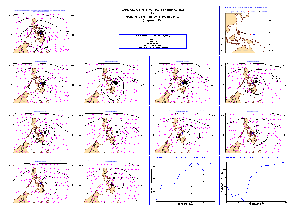
The figure above shows verification of the MSLP fields valid 8 Nov 00 UTC. For high-resolution ps-file, click here. Already the HRES forecast from 10 days before had a cyclone in vicinity of the Philippines. In the forecast from the 3 and 4 November the cyclone starts to be more intense. However, the minimum pressure error is very large (60-70 hPa).
3.
...
3 ENS
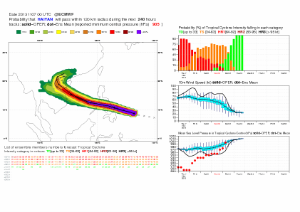

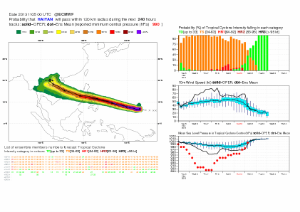
The figures above shows the strike probability product from 7, 6, 5 and 4 November 00 UTC. Here we see a very consistent ensemble regarding the track, but the ensemble has even higher minimum pressure than the HRES.
3.
...
4 Monthly forecasts


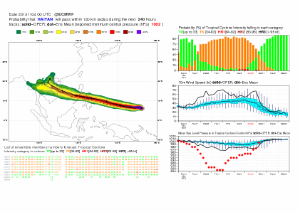
Strike probability of a tropical storm for the period 4 to 10 November. forecasts from 4 Nov, 31 Oct, 28 Oct, 24 Oct and 21 October. As expected for above the forecast from 4 November had a high strike probability. For the earlier forecasts there is a risk for a cyclone (however we have to check how different the probabilities are from the climatology).
3.
...
5 Comparison with other centres


Control forecasts (from TIGGE) from ECMWF, UKMO, NCEP and JMA. The plots above show MSLP for forecasts initialised 6 Nov 12 UTC and valid 8 Nov 00 UTC.
...