...
The figure above shows verification of the MSLP fields valid 8 Nov 00 UTC. For high-resolution ps-file, click here. Already the HRES forecast from 10 days before had a cyclone in vicinity of the Philippines. In the forecast from the 3 and 4 November the cyclone starts to be more intense. However, the minimum pressure error is very large (60-70 hPa).
3.3 ENS

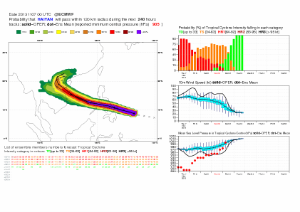

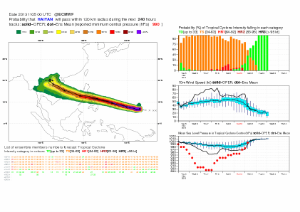
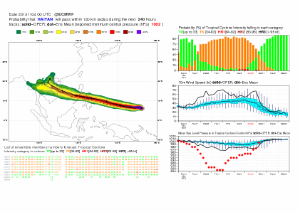
The figures above shows the strike probability product from 8, 7, 6, 5 and 4 November 00 UTC. Here we see a very consistent ensemble regarding the track, but the ensemble has even higher minimum pressure than the HRES.
...
From the WGNE Intercomparison of Tropical Cyclone Track Forecasts, I (Linus) found the following diagnostics of tropical cyclone minimum pressure. The figures below shows scatter plots of observed vs. modelled pressure for the north-western Pactific for the season of 2010. The plots are for ECMWF, UKMO, NCEP and JMA.


For this period, ECMWF seems to have the strongest relation between the observed and modelled depth. The deepest observed typhoon here was Megi with a minimum pressure of less than 900 hPa.For the other centres, NCEP and UKMO have the worst underestimation of the pressure.