...
The WV satellite image shows an active cyclone located in Colorado with a cold front attached moving eastwards crossing the SE Texas and Arkansas. A very active region of convection is seen ahead of the cold front where most of the severe weather events have been reported.

Radar animation for the 27 April from www.weatherunderground.com .
3. Predictability
3.1 Data assimilation

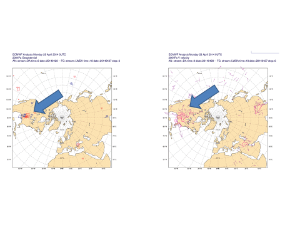
The "rejection charts" (left) highlight a cluster of wind and temp observations with low weight which seems to be related with the strong convective activity in the region. The increment charts at 200 hPa (right) suggest that the observations are trying to "correct" the background even under these conditions.
3.2 HRES


CAPE for 27 April +24h and precipitation for +23h to +24h. Little Rock is marked with an hourglass symbol.The maximum 1-hour precipitation was 20 mm/h.
3.3 ENS
Gallery includeLabel cape_efi_0 sort comment title CAPE EFI 0-24h
The figures above show the CAPE EFI (shades), precipitation (green symbols) and the ensemble mean of z500 (blue countours)contours) valid for the first forecast day. Little Rock is marked with an hourglass symbol. The EFI is valid for 27 April 00UTC to 28 April 00UTC.
3.4 Monthly forecasts
3.5 Comparison with other centres
4. Experience from general performance/other cases
5. Good and bad aspects of the forecasts for the event
...
This plots show the evolution of the weather situation.