...
The incredible thing is that the precipitation has been generated by a single MCS, classifiable as "V-shape", that formed upstream the Apennines in a warm and humid south-westerly blowing from the Gulf of Genova. It started ad 18 UTC and it lasted approximately up to 6 UTC, just changing shape and moving a little bit, but substantially remained almost stationary. See the picture below taken at 00UTC 14/09/2015. This has generated more than 300mm, recorded by many stations on the upper part of those basins. The precipitation intensity was also striking with 4 stations recording more than 110mm per hour and almost 10 stations recording more than 80 mm per hour. See the map of the total precipitation fallen during the event between 13 and 14/09 over the station network of Emilia-Romagna
The plot below shows the radar data from Veneto 1440 on 14 September, with the supercell that caused the hailstorm.
...
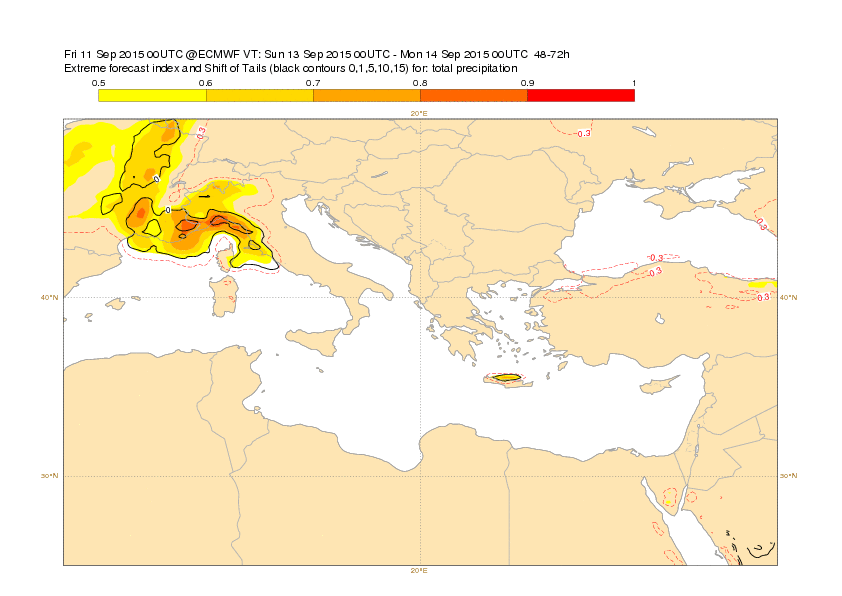
EFI and SOT for precipitation (from 13 Sept 00z, 12 Sept 00z and 11 Sept 00z)


Monday 14 Sept
...
3.5 Comparison with other centres
Sunday 13 September 06z - 14 September 06z (focusing on NW Italy), ONLY 16 MEMBERS PLOTTED
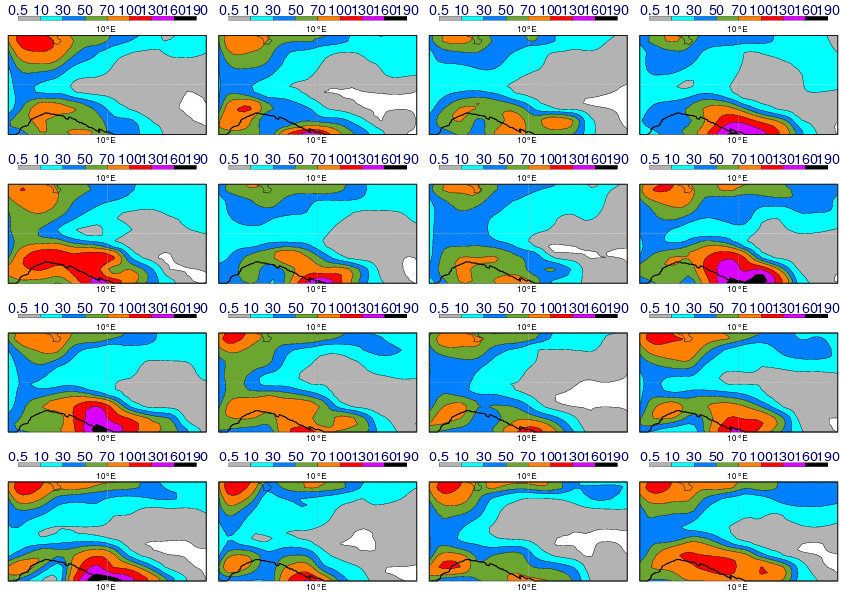
ECMWF (13 Sept 00z, 12 Sept 12z, 12 Sept 00z)


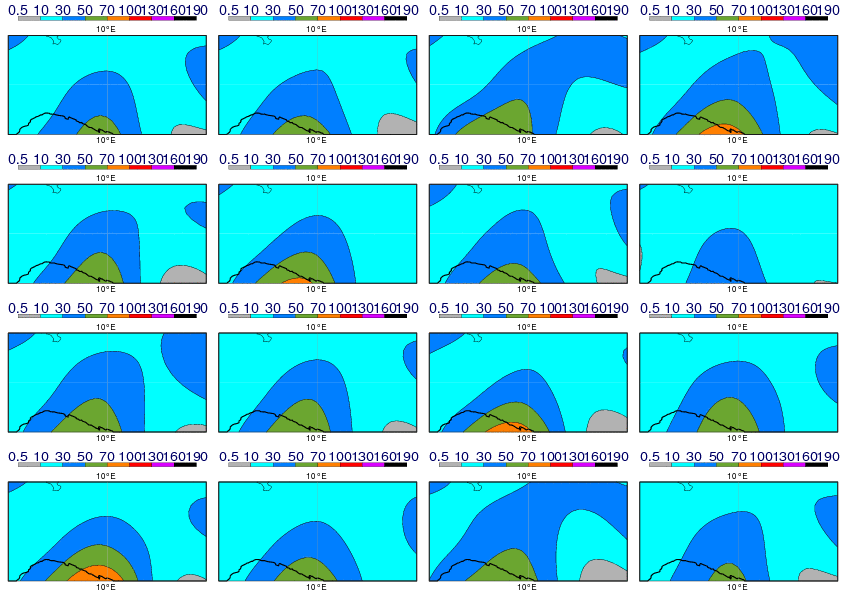
NCEP(13 Sept 00z, 12 Sept 12z, 12 Sept 00z)


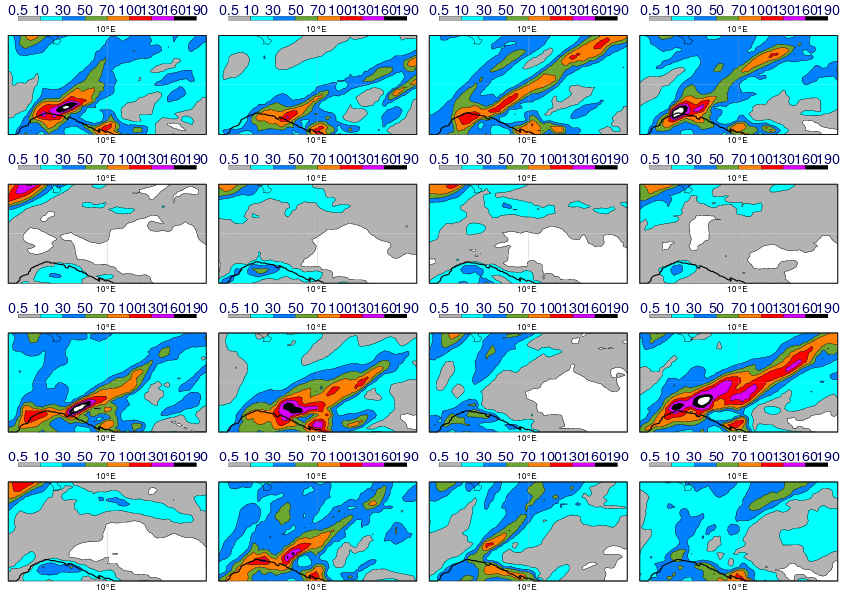
COSMO-LEPS (13 Sept 00z, 12 Sept 12z, 12 Sept 00z)


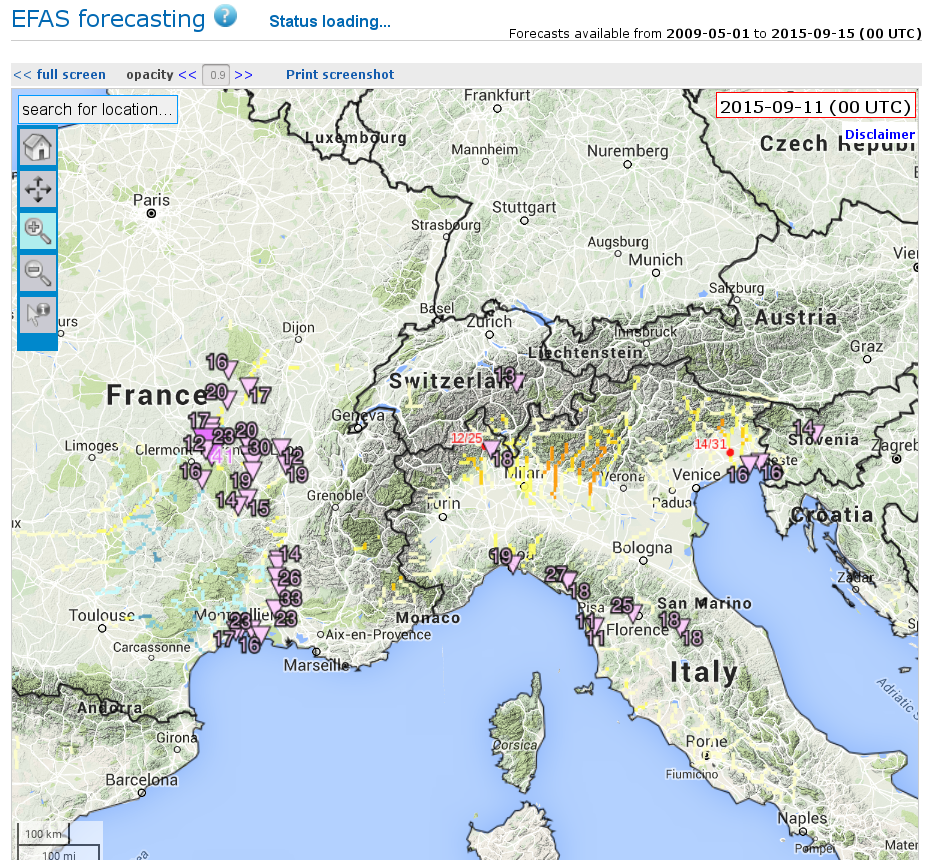
3.6 EFAS
EPIC


ERIC

4. Experience from general performance/other cases
...