Versions Compared

Key

  • This line was added.
  • This line was removed.
  • Formatting was changed.

...

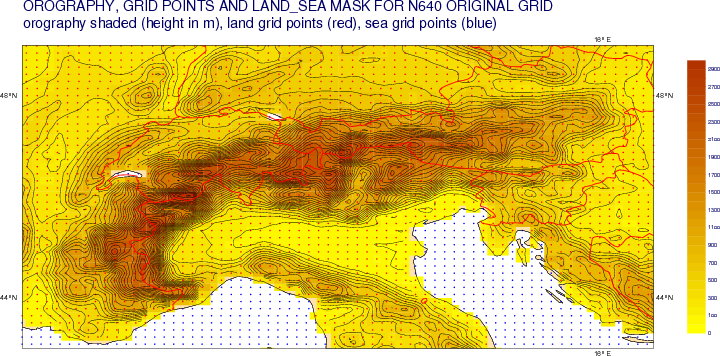
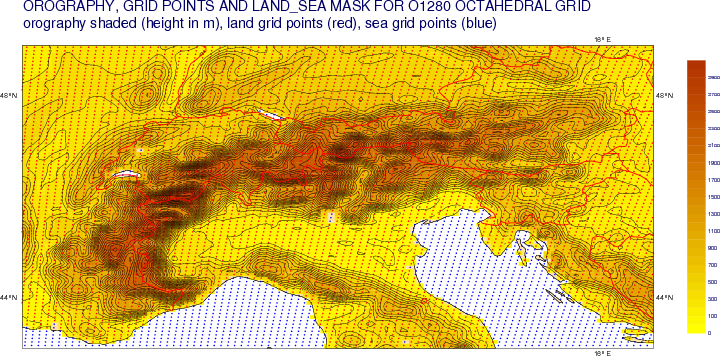
Old:  N640 original reduced Gaussian grid (~16 km resolution)New: O1280 octahedral reduced Gaussian grid (~9 km resolution)
N640 original reduced Gaussian gridImage RemovedN640 original reduced Gaussian gridImage AddedO1280 octahedral reduced Gaussian gridImage RemovedO1280 octahedral reduced Gaussian gridImage Added

...

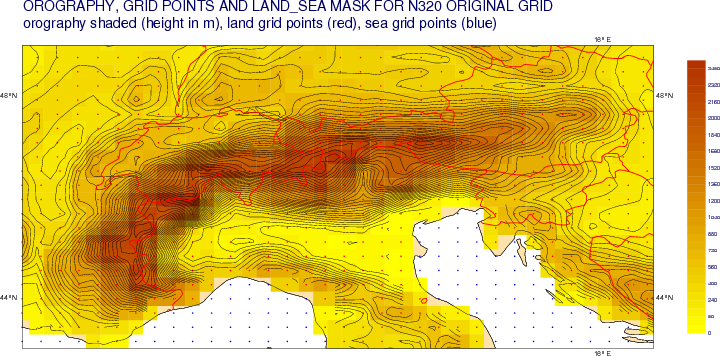
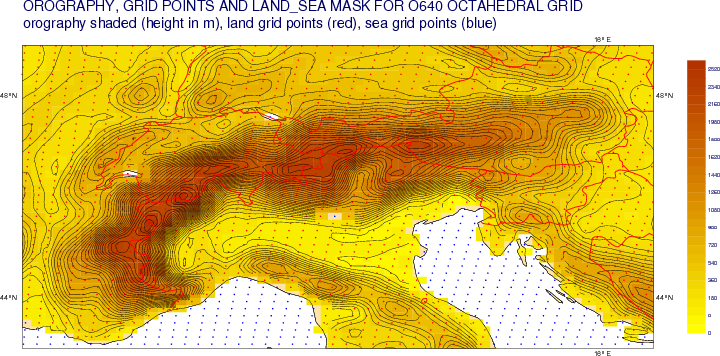
Old Day 0 - 10: N320 original reduced Gaussian grid (~32 km resolution)New Day 0 - 15: O640 octahedral reduced Gaussian grid (~18 km resolution)
N320 original reduced Gaussian gridImage RemovedN320 original reduced Gaussian gridImage AddedO640 octahedral reduced Gaussian gridImage RemovedO640 octahedral reduced Gaussian gridImage Added
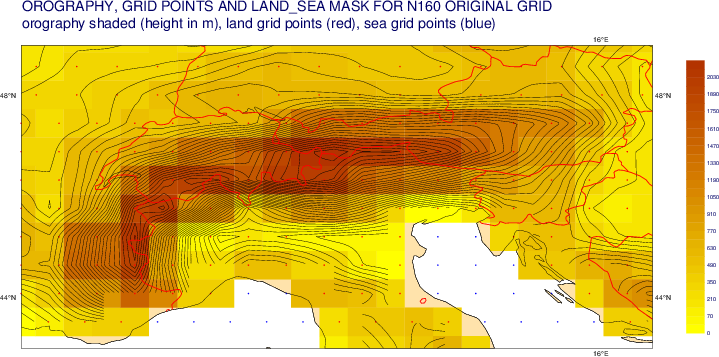
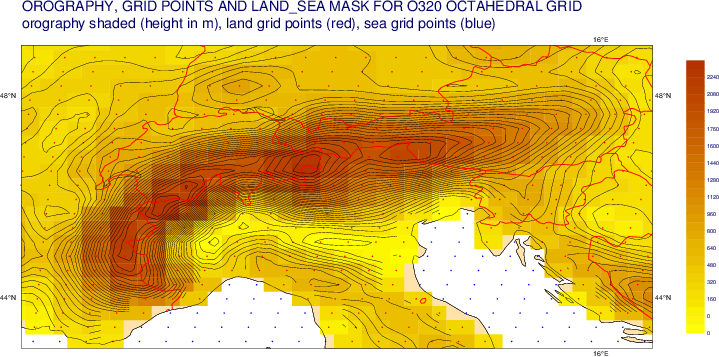
Old Day 11 - 46 : N160 original reduced Gaussian grid (~64 km resolution)New Day 16 - 46: O320 octahedral reduced Gaussian grid (~36 km resolution)
N160 original reduced Gaussian gridImage RemovedN160 original reduced Gaussian gridImage AddedO320 octahedral reduced Gaussian gridImage RemovedO320 octahedral reduced Gaussian gridImage Added

...

IFS cycle 41r2 test data is accessible via the ecCharts layers menu, identified by the label "esuite 0069" as shown in the screenshot on the left. They can be displayed as any other layers of ecCharts, and they can be saved in the Dashboard, as seen in the screenshot on the right.


Column
ecCharts - forecaster viewImage Modified


Column

ecCharts -  dashboard viewImage Modified

The point probe and time series tools will be also available for the 41r2 test data.

...

ENS Meteograms based on IFS cycle 41r2 test data can be plotted by choosing 'E-suite' under the Experiment tab on the interactive page ENS meteogram page provided under the ECMWF Forecast Charts page as shown in the screenshot below.
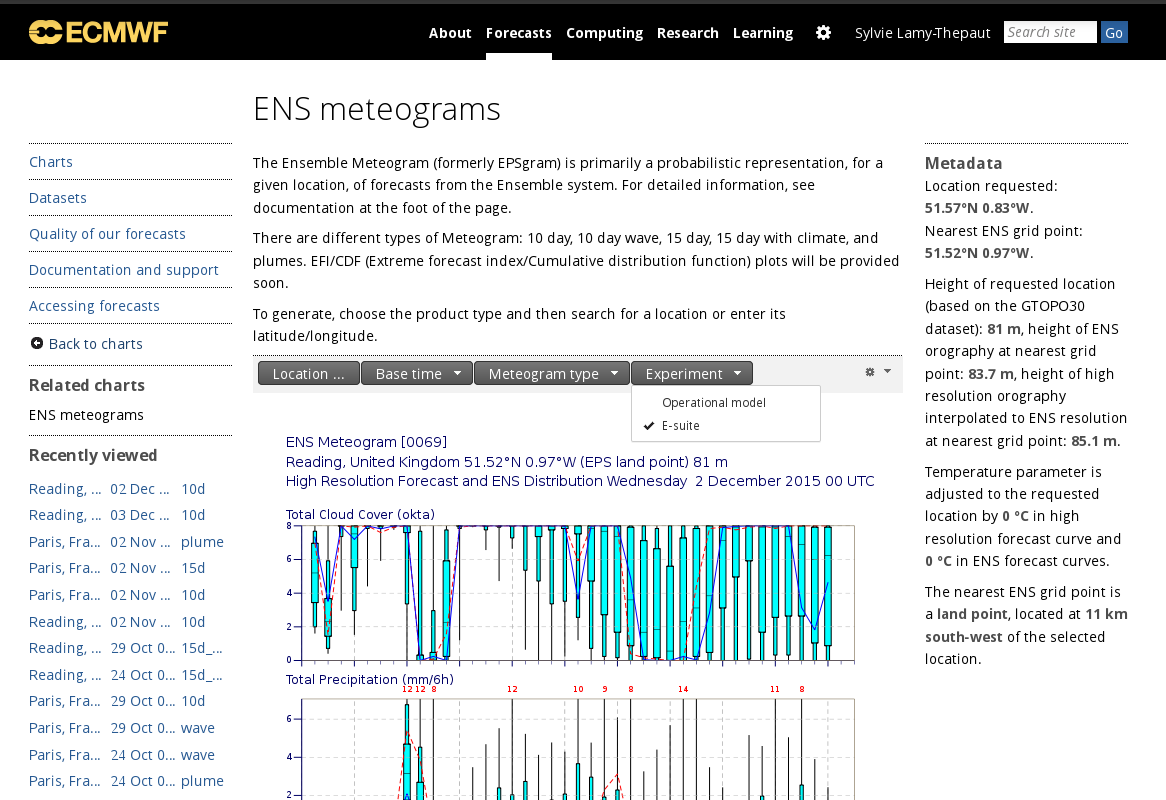

ENS meteogramImage RemovedENS meteogramImage Added

Contact us

...