...
The plots below show analyses of MSLP and 6 hour rainfall from 1 October 12UTC to 4 October 12UTC, every 12th hour.
2.3 Observations
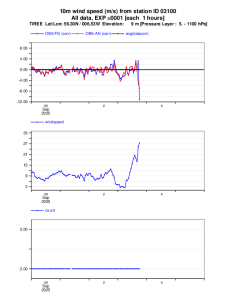
The plot below shows the time series of 10-metre wind speed observation for Tiree and analysis and first guess departures.
2.4 Climatological perspective
...
EFI (based on IFS 9-km ensemble)
Forecast Evolution plot
...
The plot below shows the same as above but for 24-hour maximum wind gusts. (But without AIFS.)
The plot below shows the evolution the 10-metre mean wind on 4 October 00UTC in a 0.5x0.5 degree box on the south-west coast of Norway (see observation plot to the right). The extreme wind speed in the both ensembles for the shortest forecast (step 0) is believed to be fixed by the changes in the tuning of the SPP scheme in 50r1.
The plot below shows the evolution of the minimum pressure in the box 3x3 degree box cented on 60N, 3W on 4 October 00UTC.
The plots below show the cyclone feature maps valid 4 October 00UTC with the dots coloured by the cyclone minimum pressure.
...
6.1 Good and bad aspects of the forecasts for the event
- Reasonable signal in the medium-range for a strong system
- Some really good forecasts from the Hybrid system
6.2 Experience from general performance/other cases
...