changes.mady.by.user Linus Magnusson
Saved on Jan 09, 2017
...
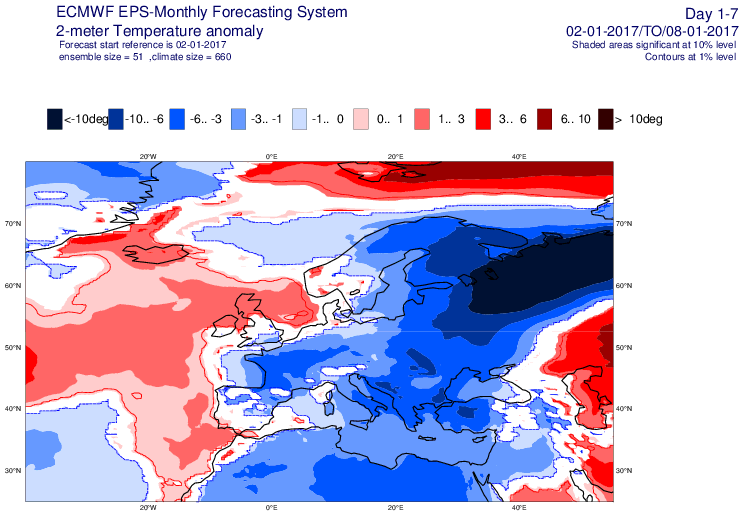
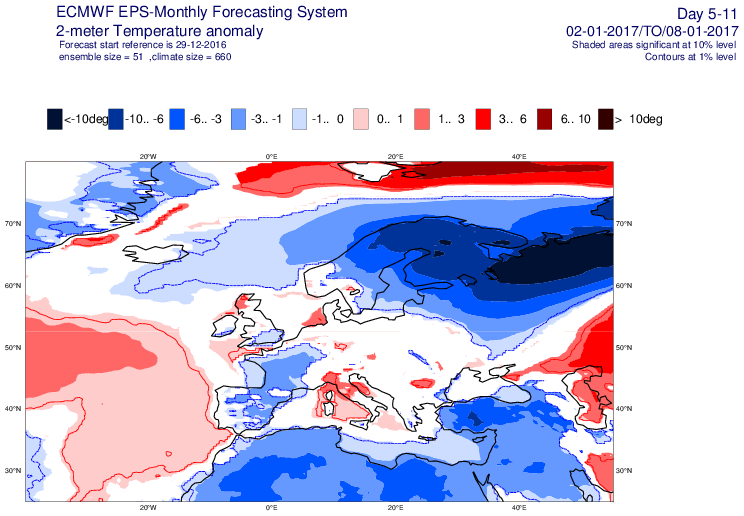
The plots below show weekly temperature anomalies for 2-8 January.
Image AddedImage AddedImage AddedImage Added