...
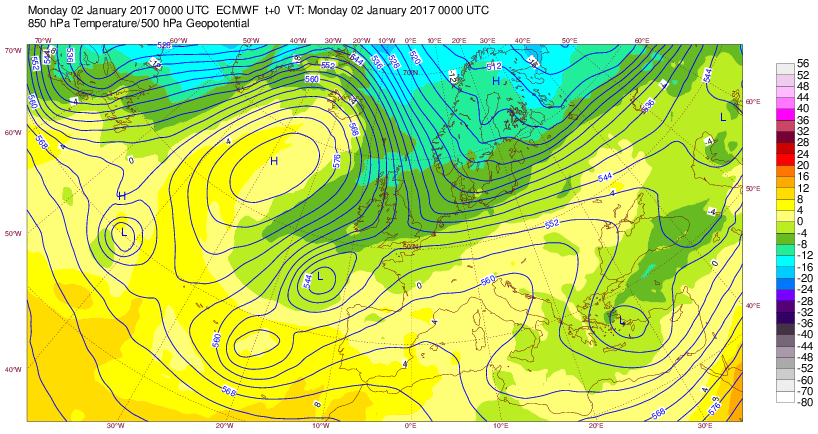
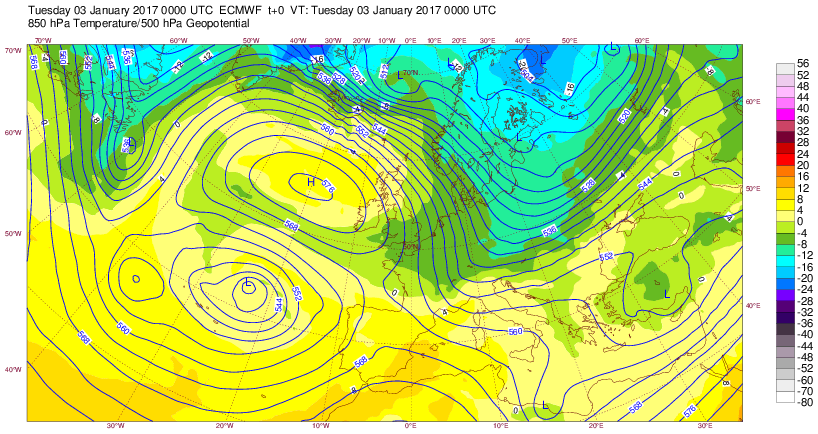
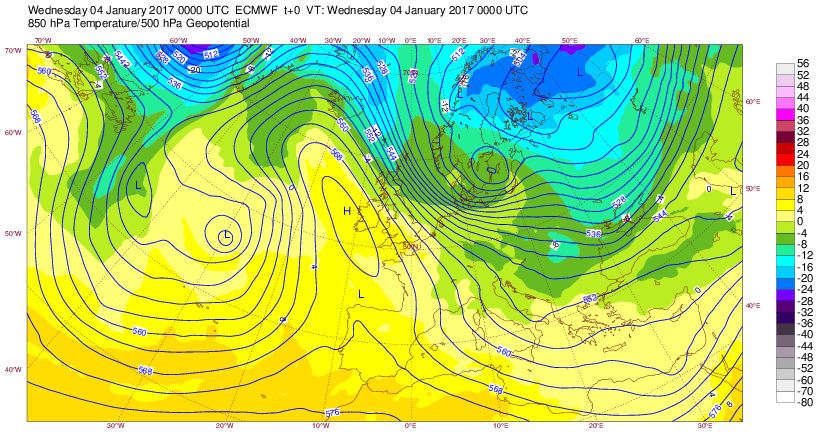
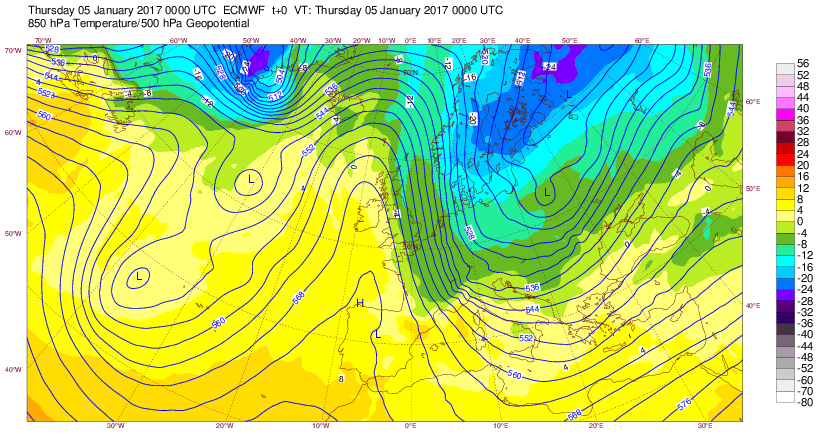
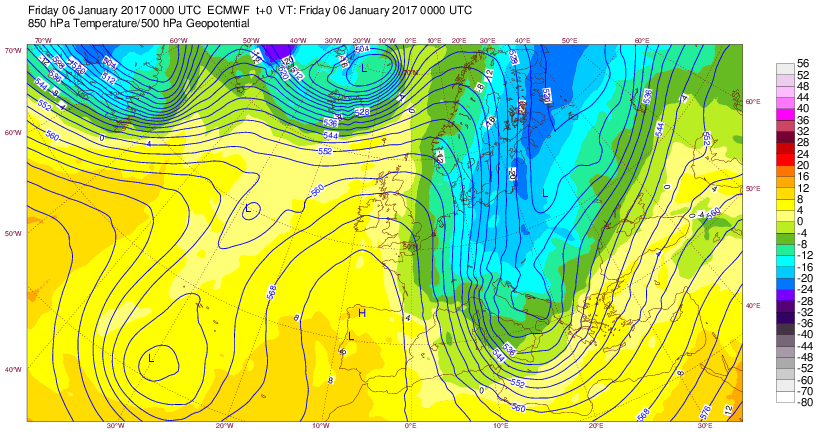
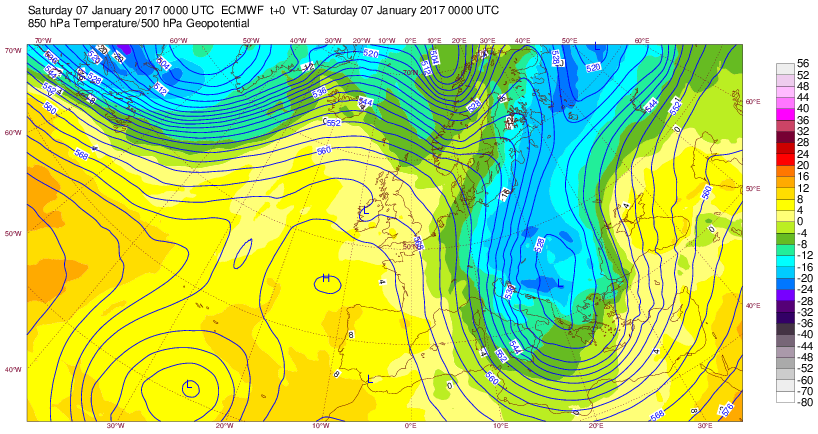
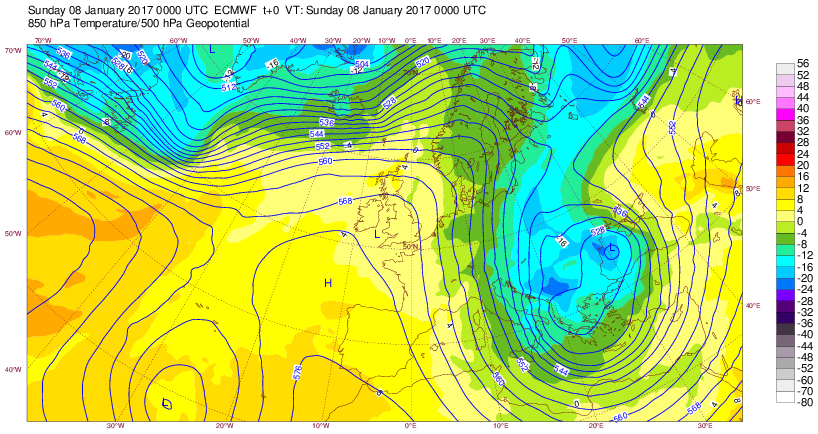
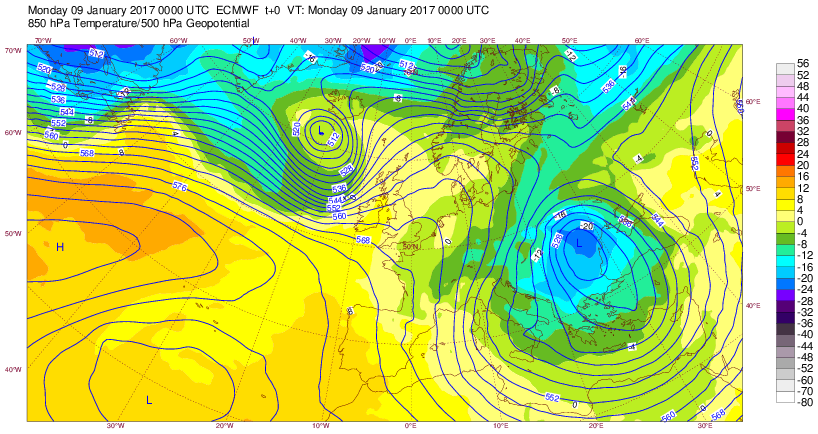
The plots below shows analyses of z500 and t850 for the period 2-9 January.

The plot above shows backward trajectories based on 850 hPa winds, starting on 1 January and ending on 9 January around Sofia. Under assumption of no vertical motion, the air parcels originated from north-eastern Russia.
The plots below show EFI and SOT for 2-metre temperature day 1 as a proxy for analysis of how extreme the temperature were from 2 to 9 January.
...