...
3. Predictability
3.1 Data assimilation
...
The plots below show observation statistics for MSLP along the track of Irma with 1 (left) and 5 degrees (right).


The plots below show the same as above put for temperature observations from drop sondes.


3.2 HRES
3.3 ENS
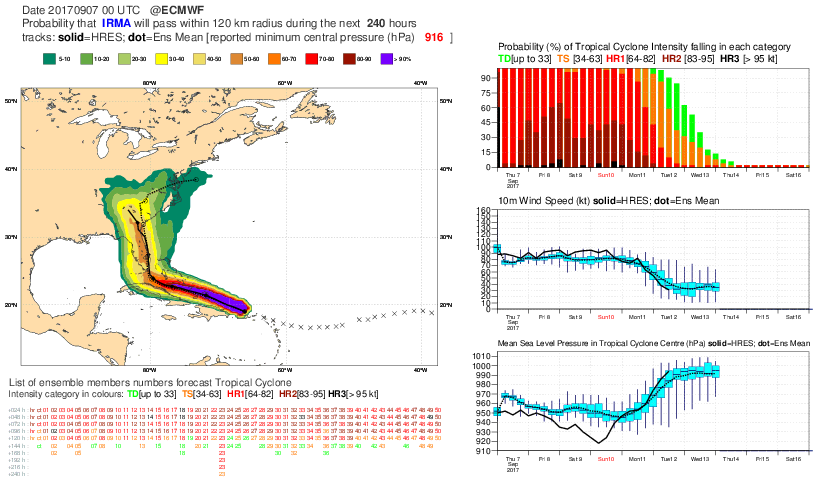
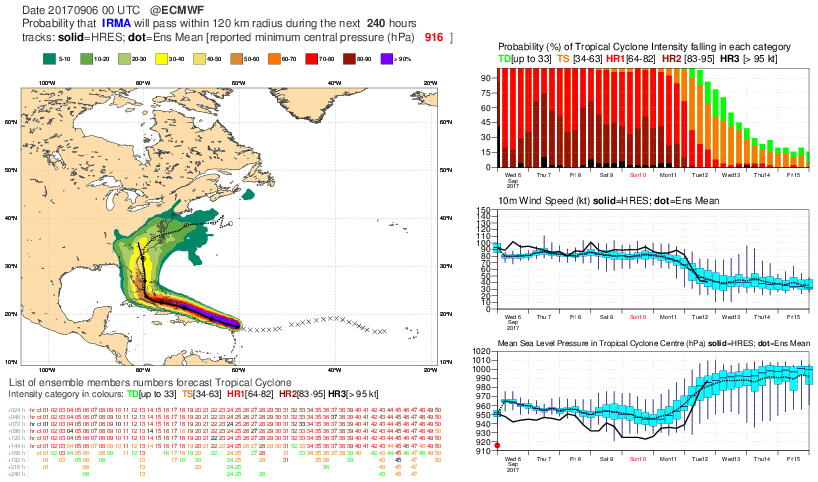
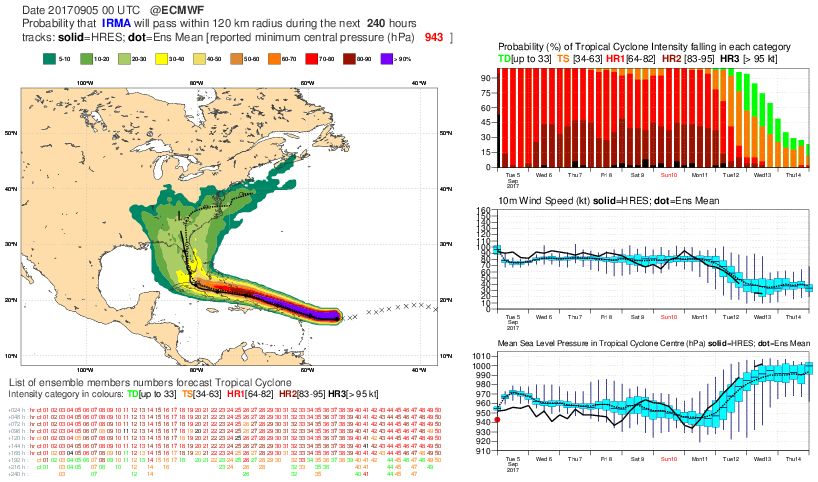
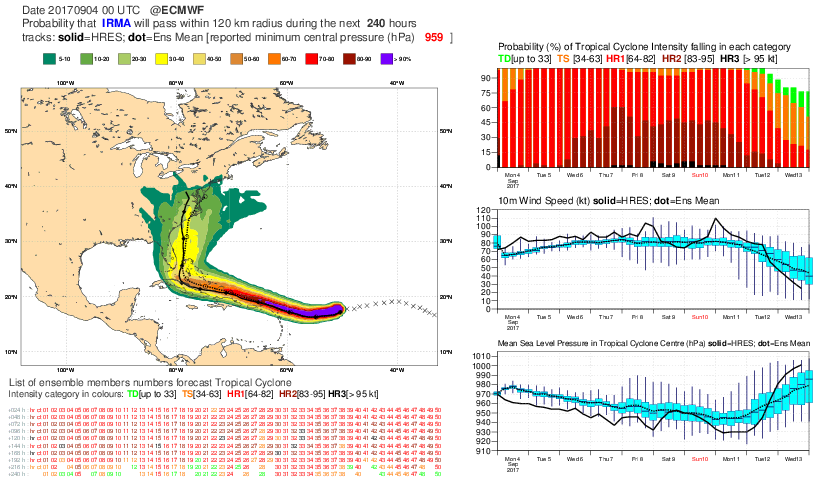
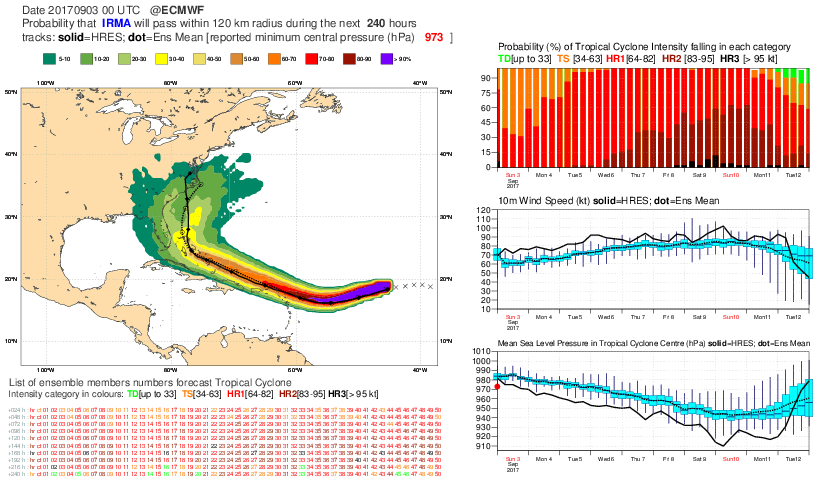
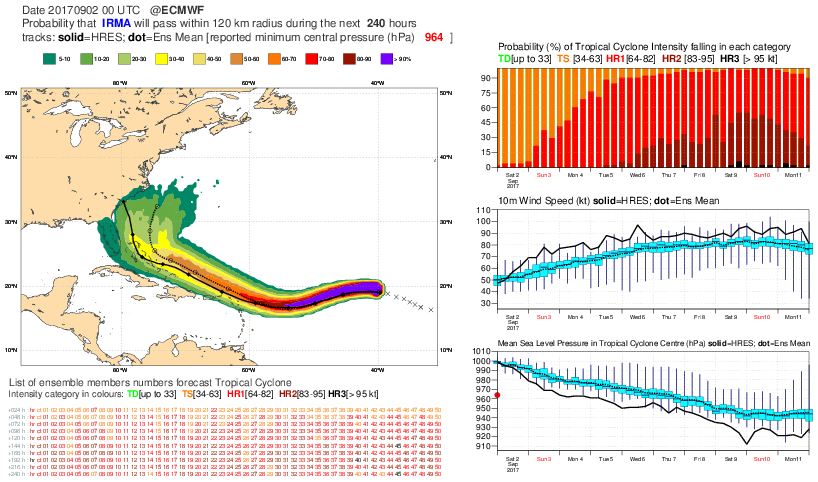
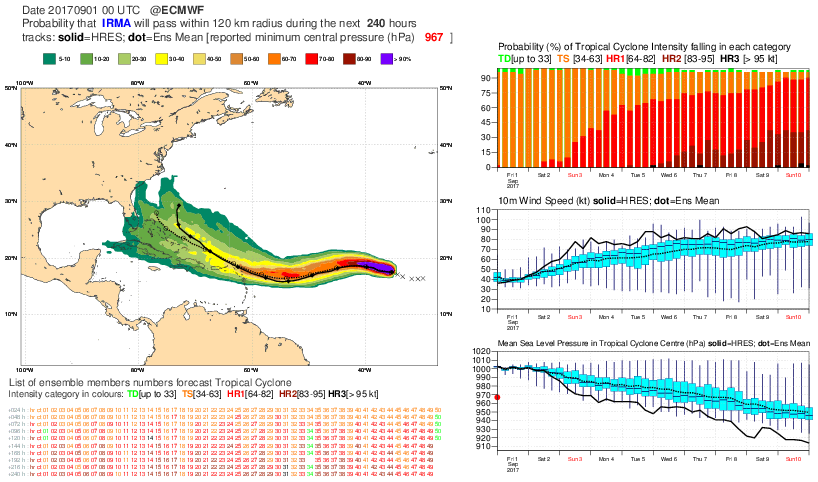
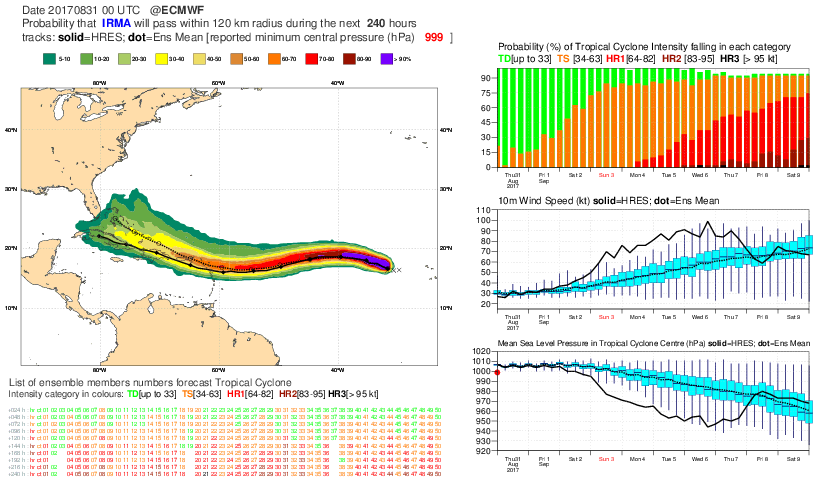
The plots below show tropical cyclone product for TC Irma (from 00z runs starting from the last run).


The plot below shows the evolution of ensemble and HRES forecasts for 48-hour maximum wind gusts (5 September 00z to 7 September 00z) for Sint Marteen/Saint Martin.

The plot below shows the evolution of ensemble and HRES forecasts for 48-hour maximum wind gusts (10 September 00z to 12 September 00z) for Key West.

3.4 Monthly forecasts
The plots below show the tropical storm activity for the week of 28 August - 3 September, when TC Irma formed west of Kap Verde. During the week the tropical depression that later became TC Jose was also present in the region. The increased activity was somehow captured from 21 August but clearly from 24 August - a week before the cyclogenesis of TC Irma. However, at this stage the track was very uncertain.
...