...
2. Description of the event
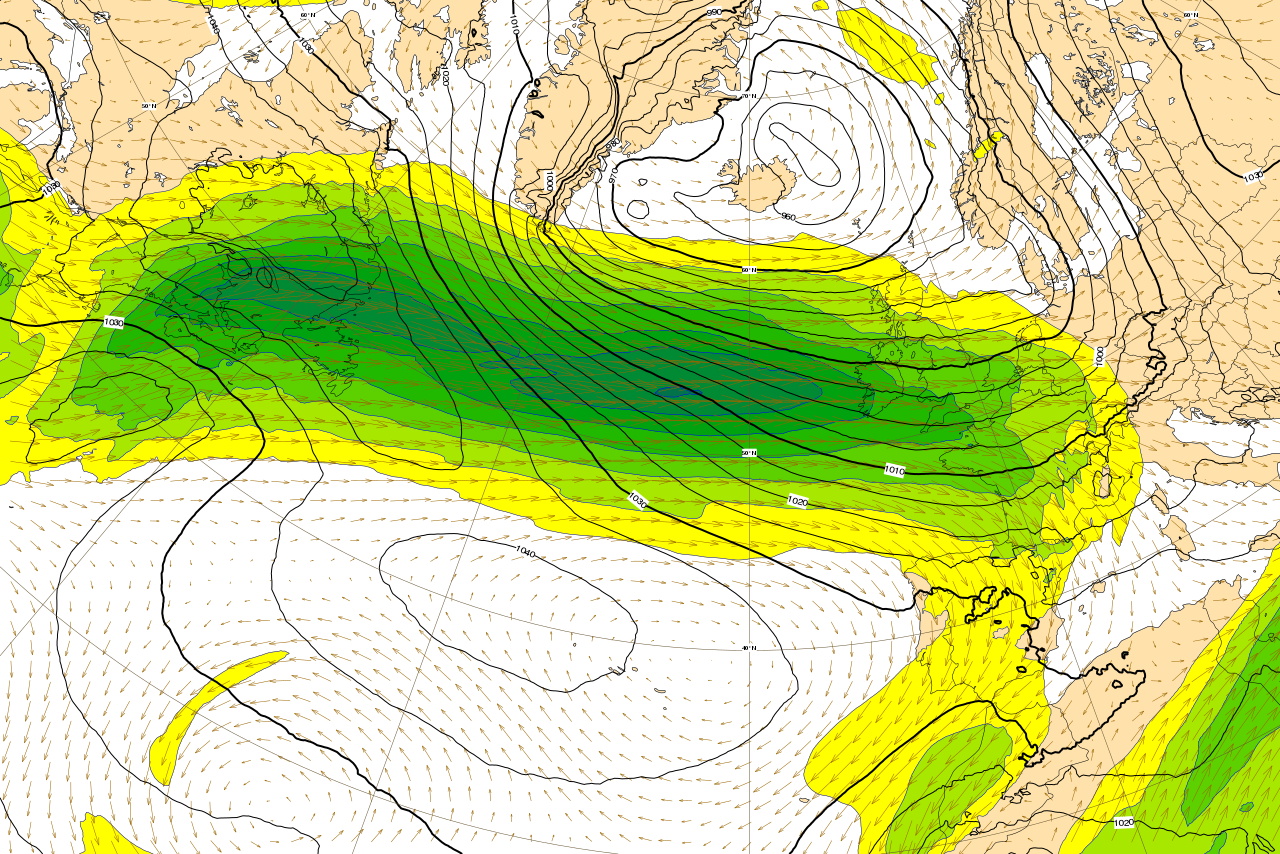
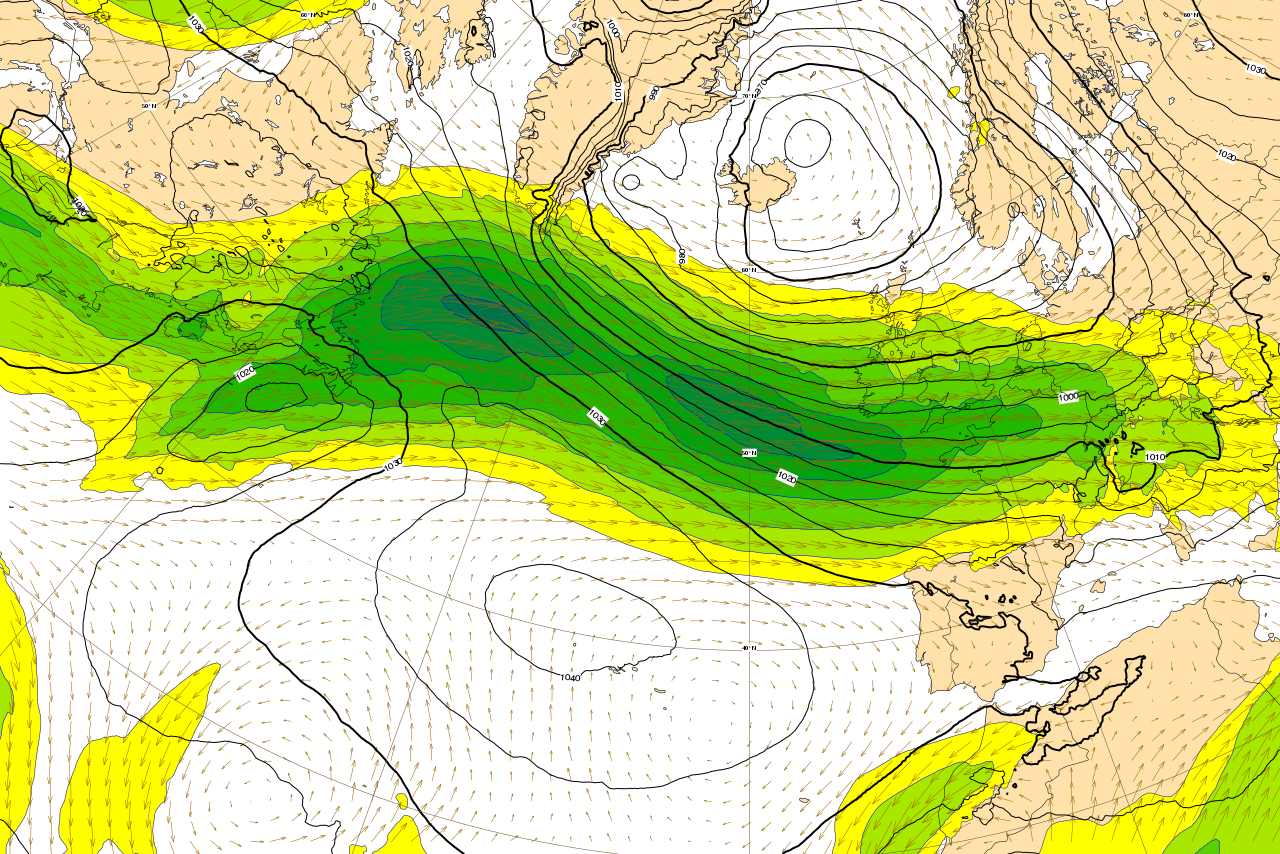
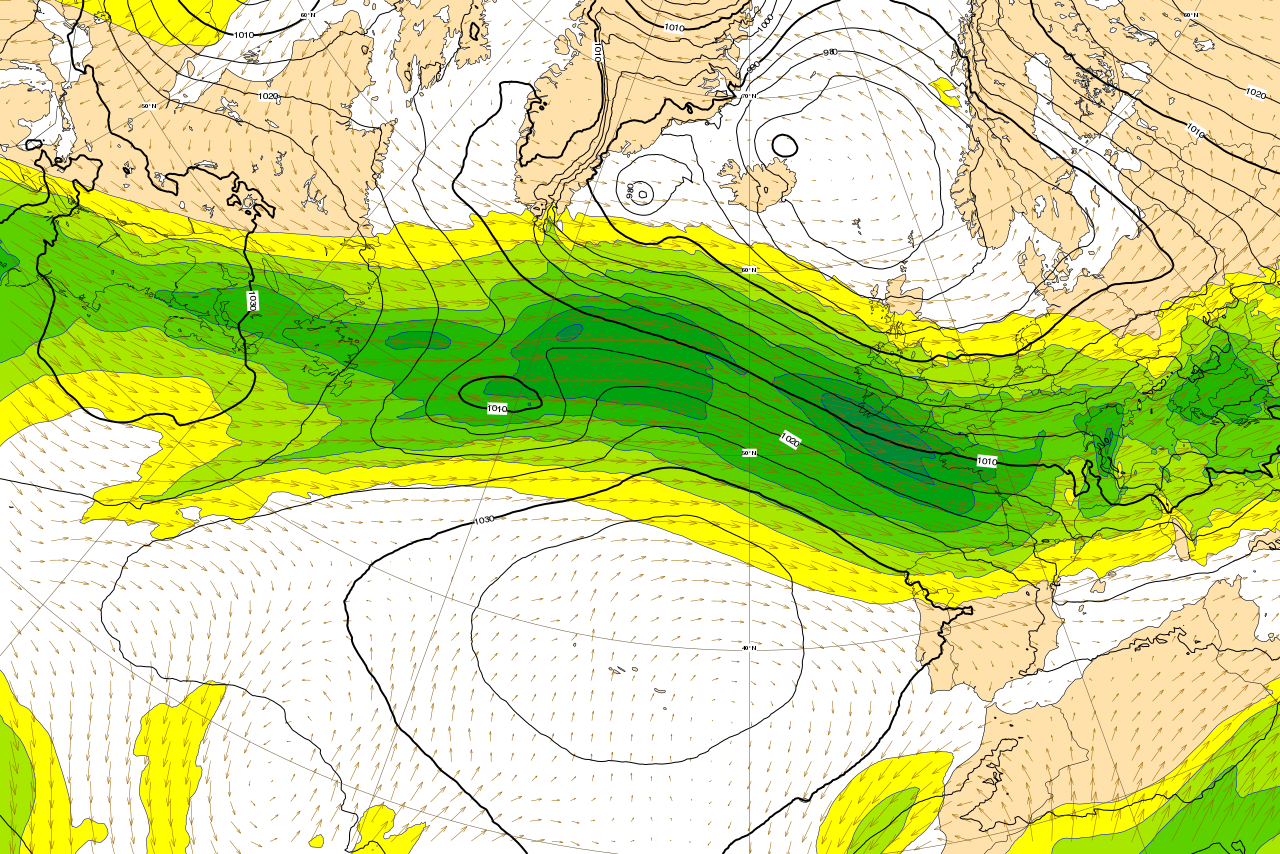
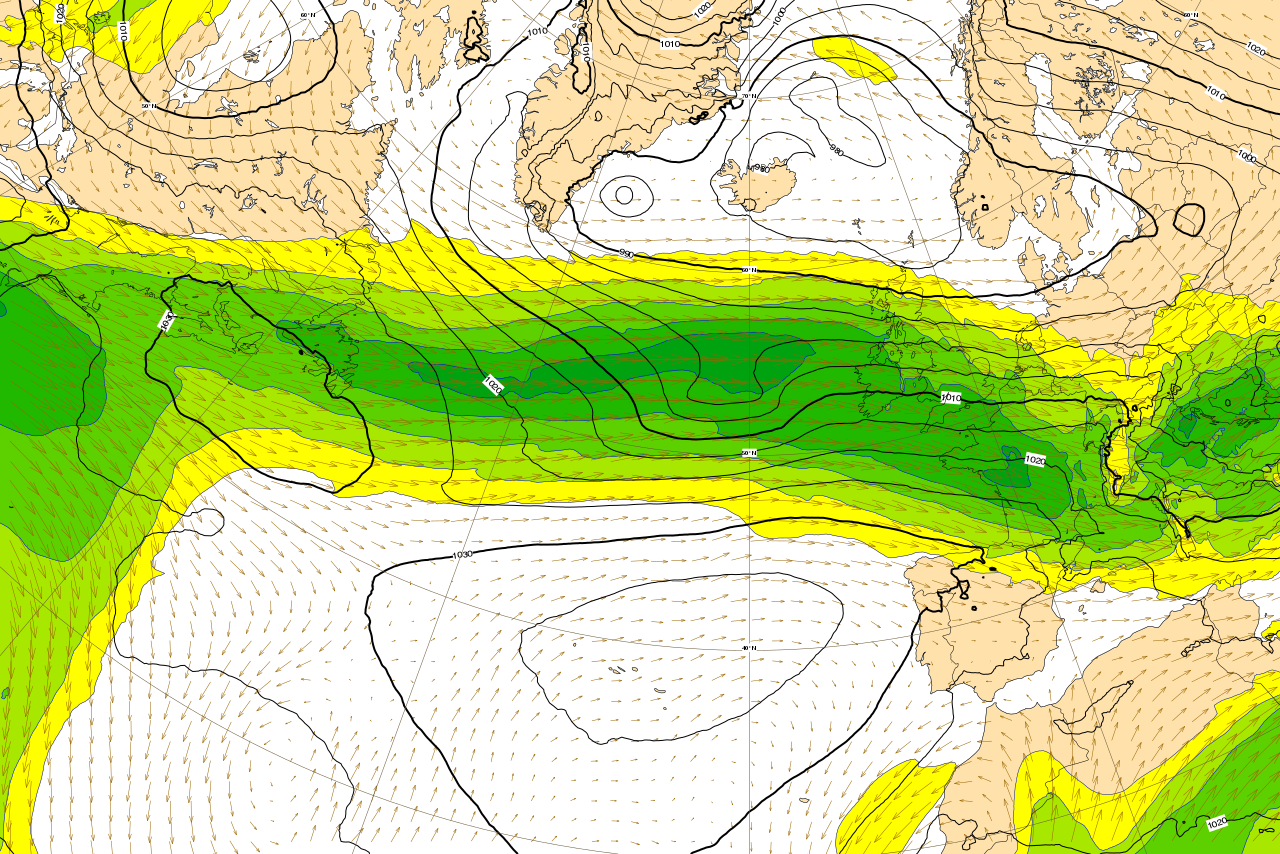
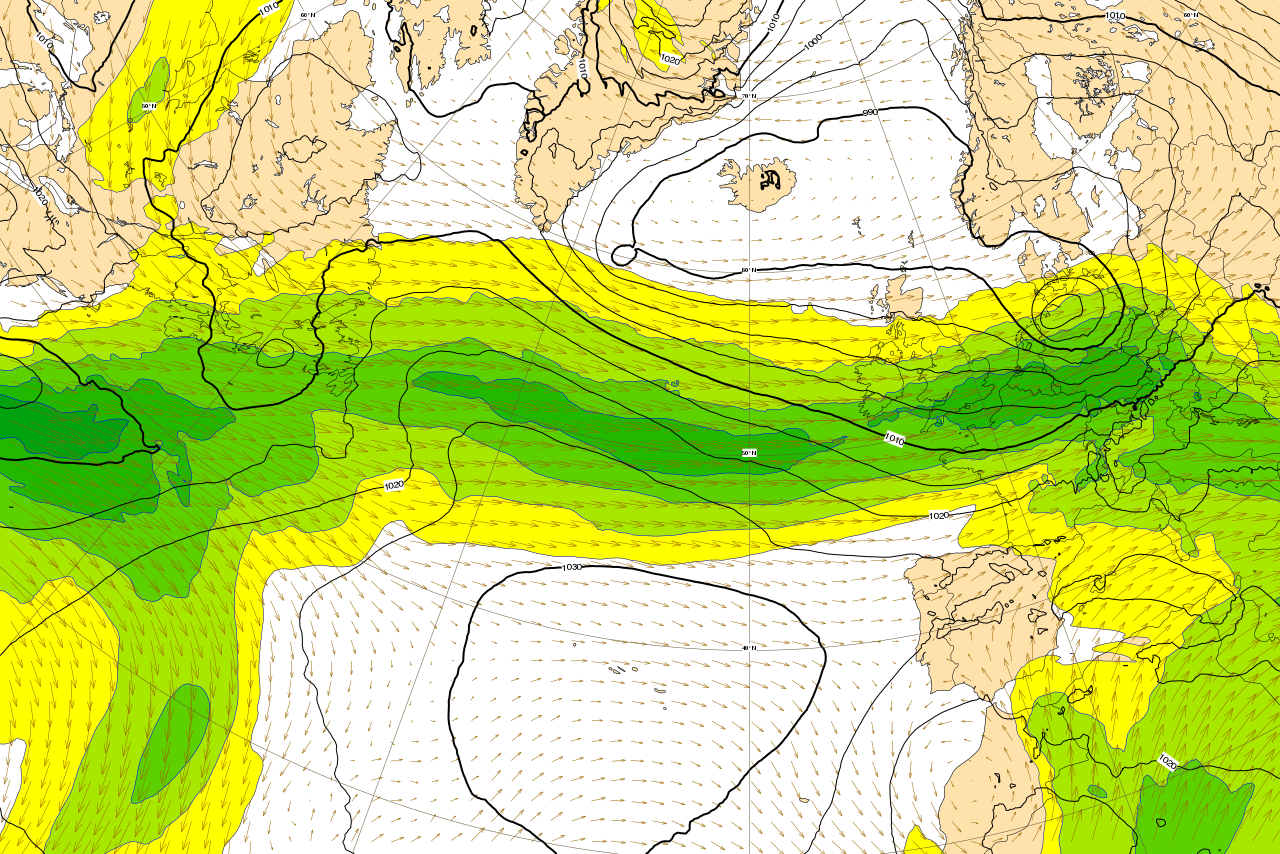
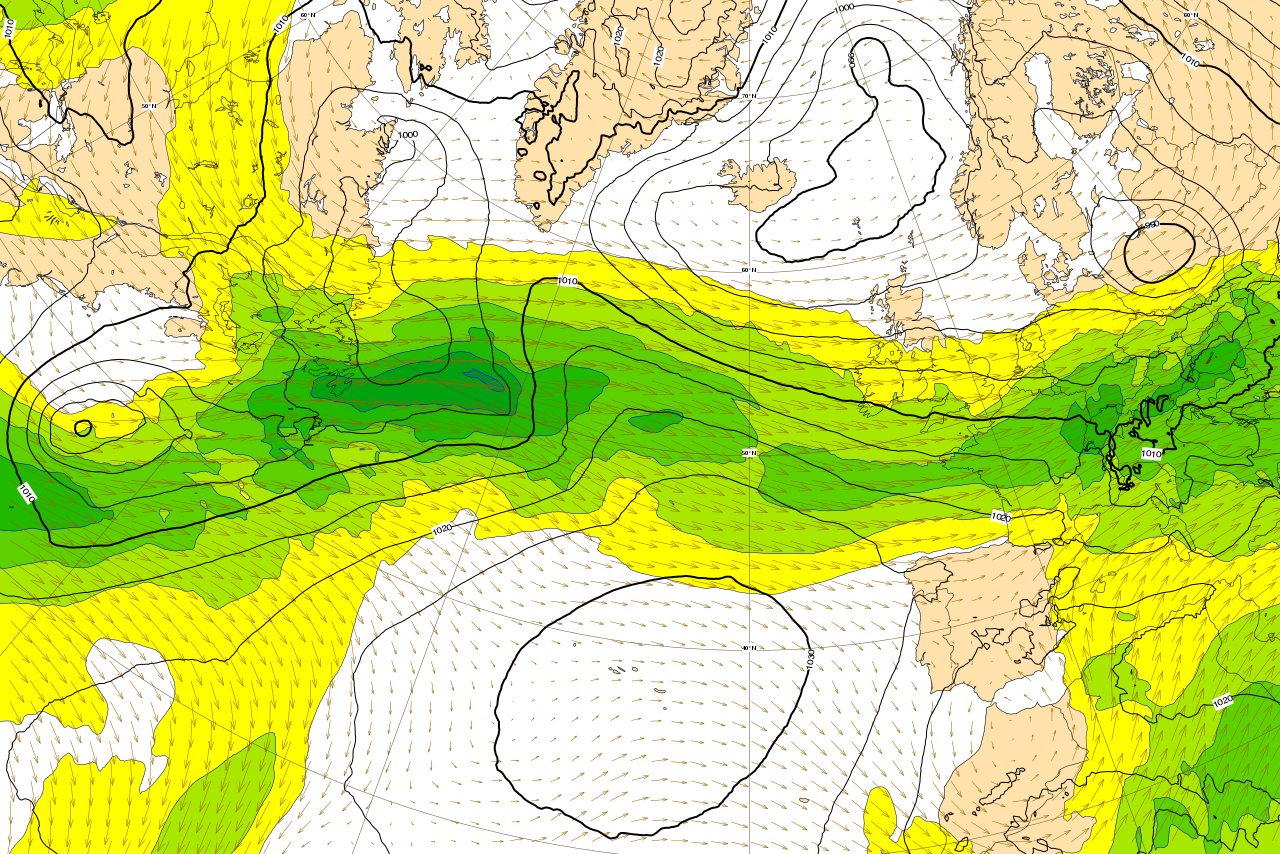
The plots below show the evolution of mslp (contour) and wind at 200hPa from 16 January 00UTC to 19 January 00UTC, every 12th hour.

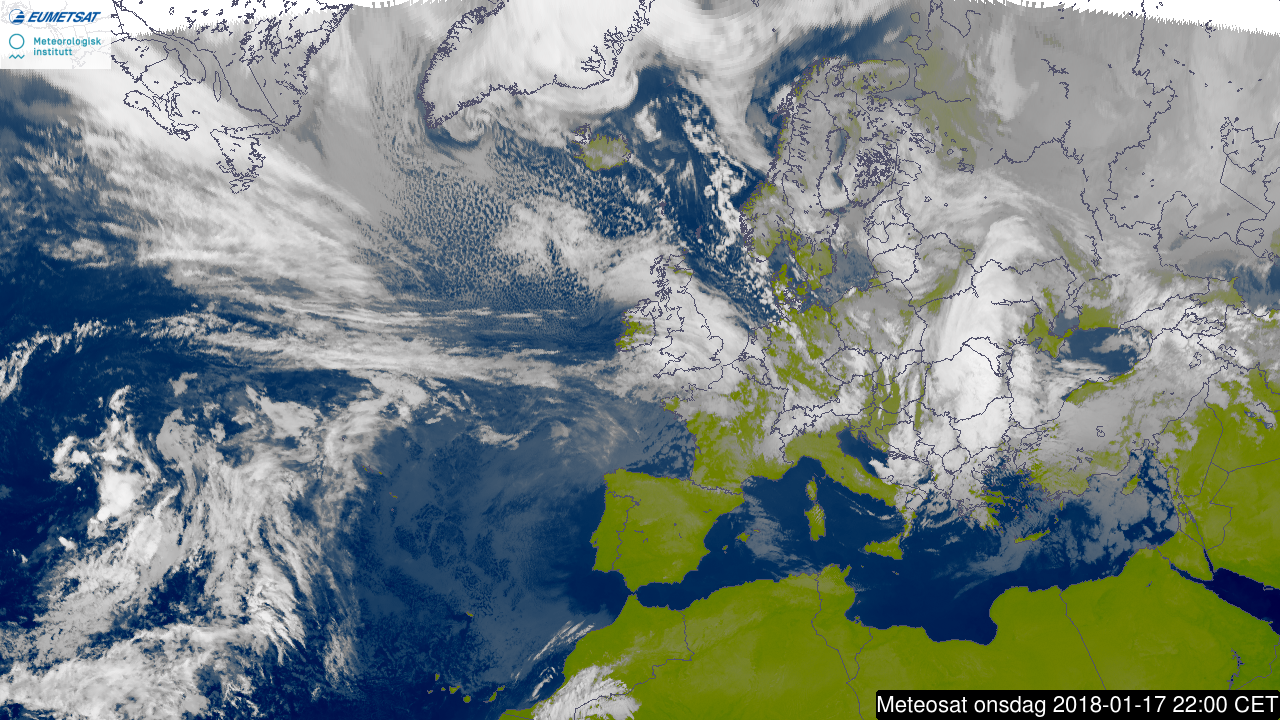
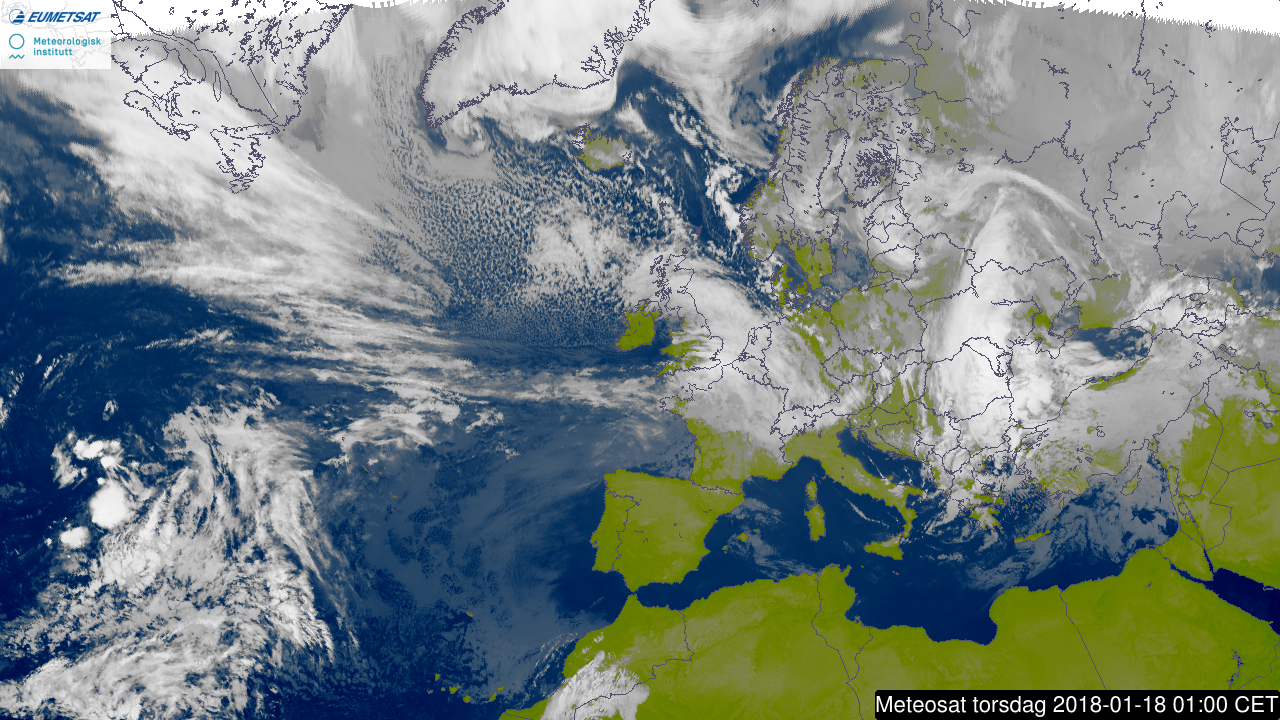
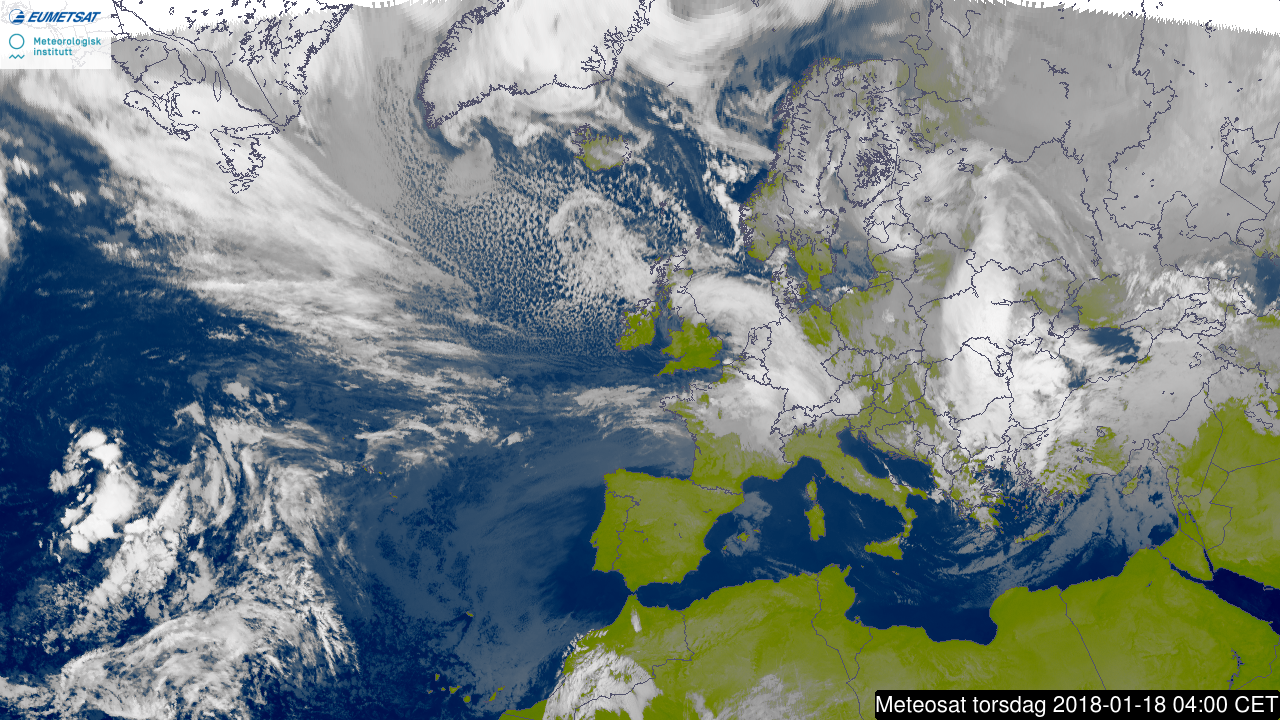
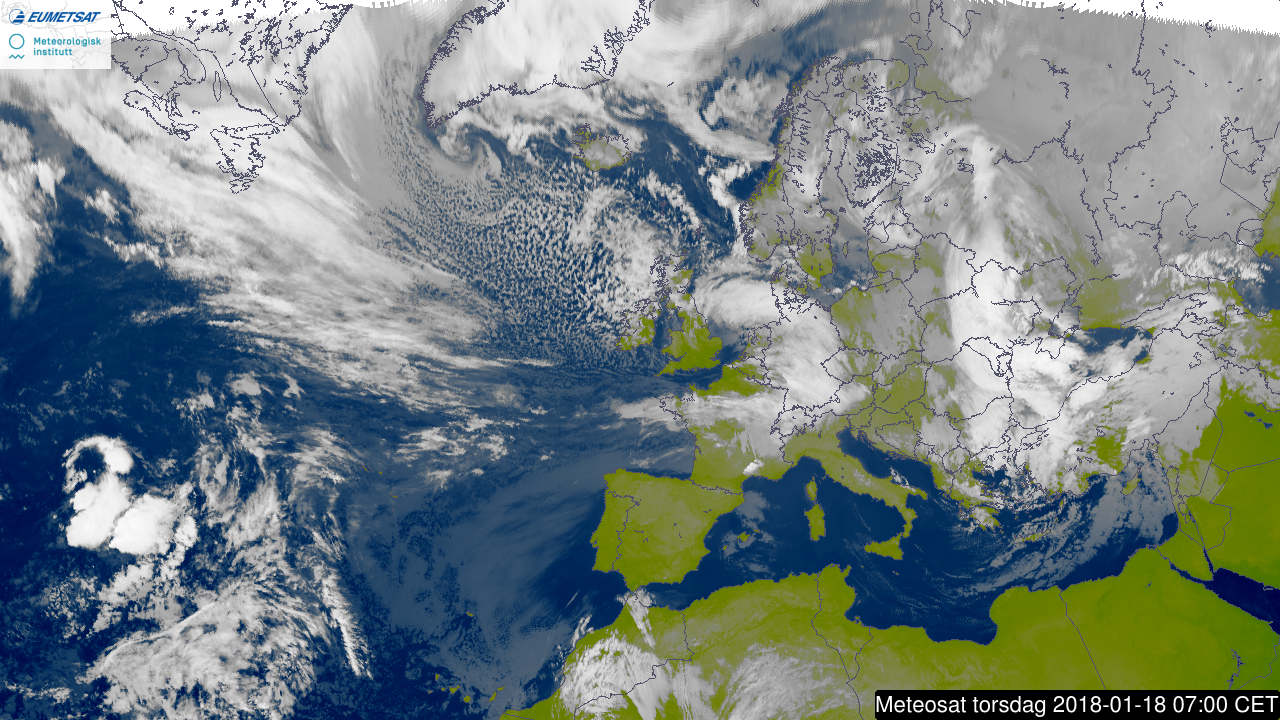
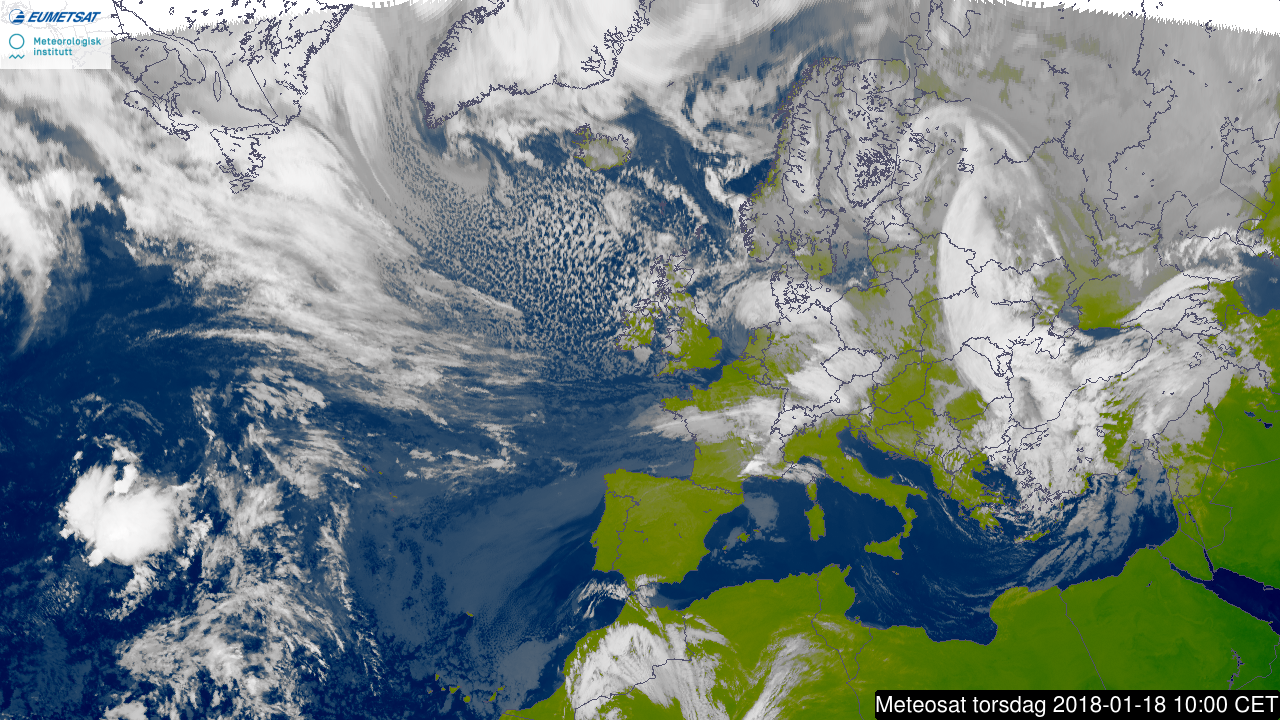
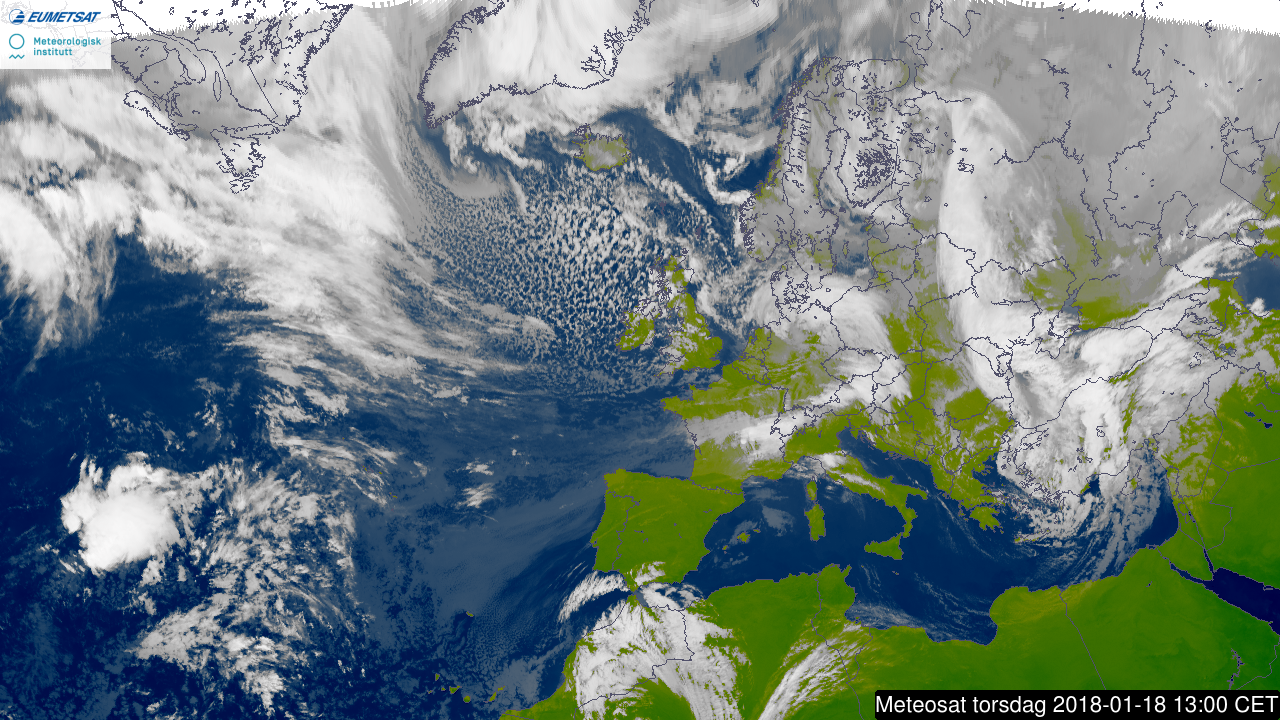
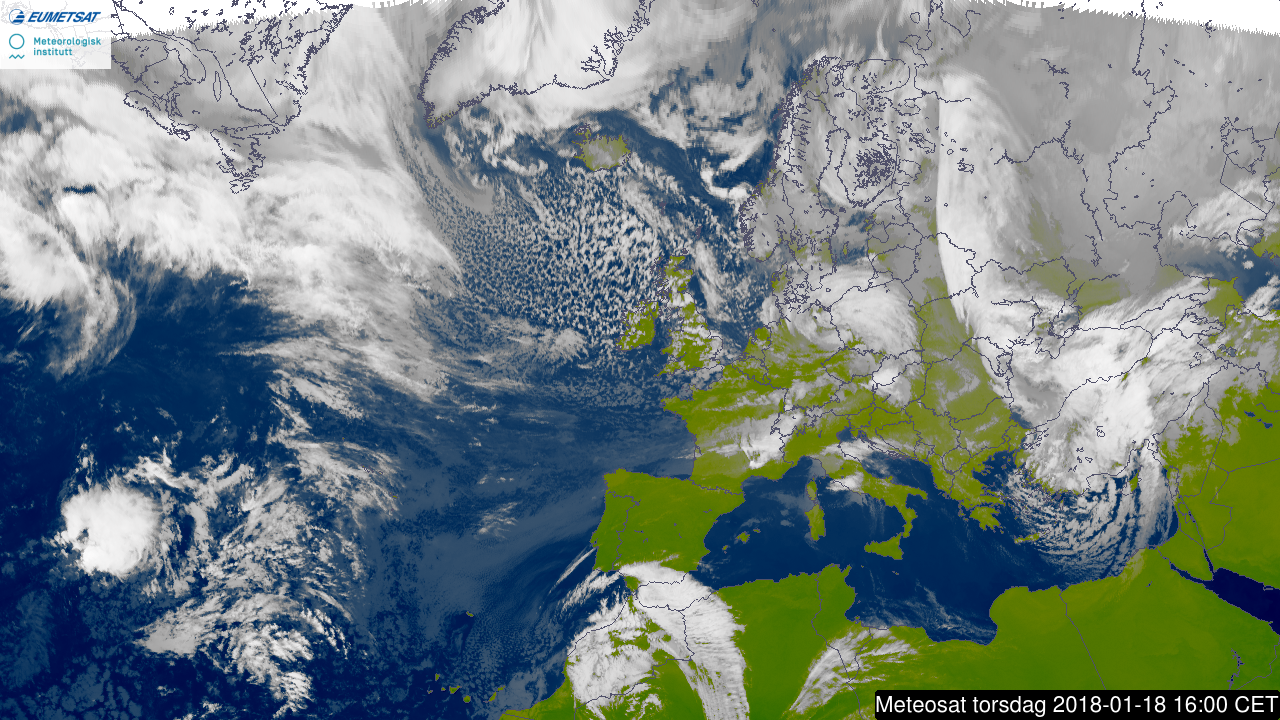
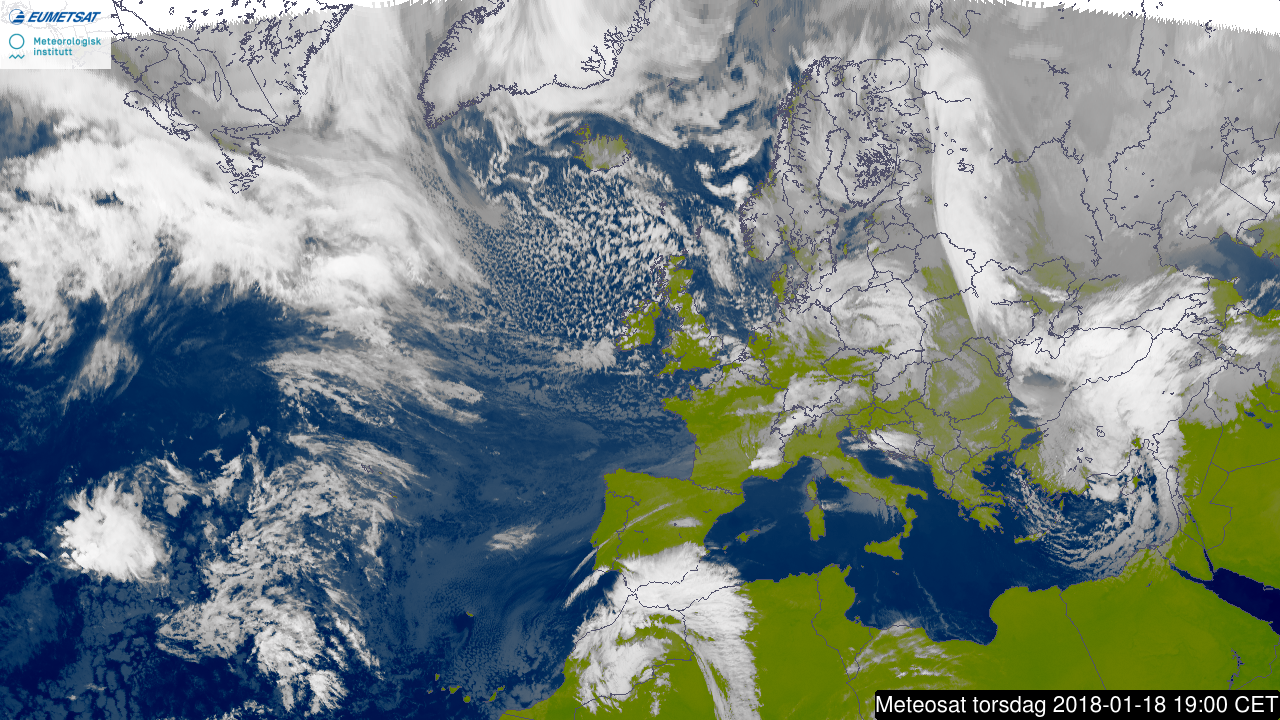
The plots below show satellite images (from yr.no) from 17 January 21UTC to 18 January 18UTC every 3rd hour.
3. Predictability
3.1 Data assimilation
...