Status:Ongoing analysis Material Status: Finalised Material from: Linus, Jonny, Ervin, Ivan
| Show If | ||||||
|---|---|---|---|---|---|---|
| ||||||
Discussed in the following Daily reports:
|
...
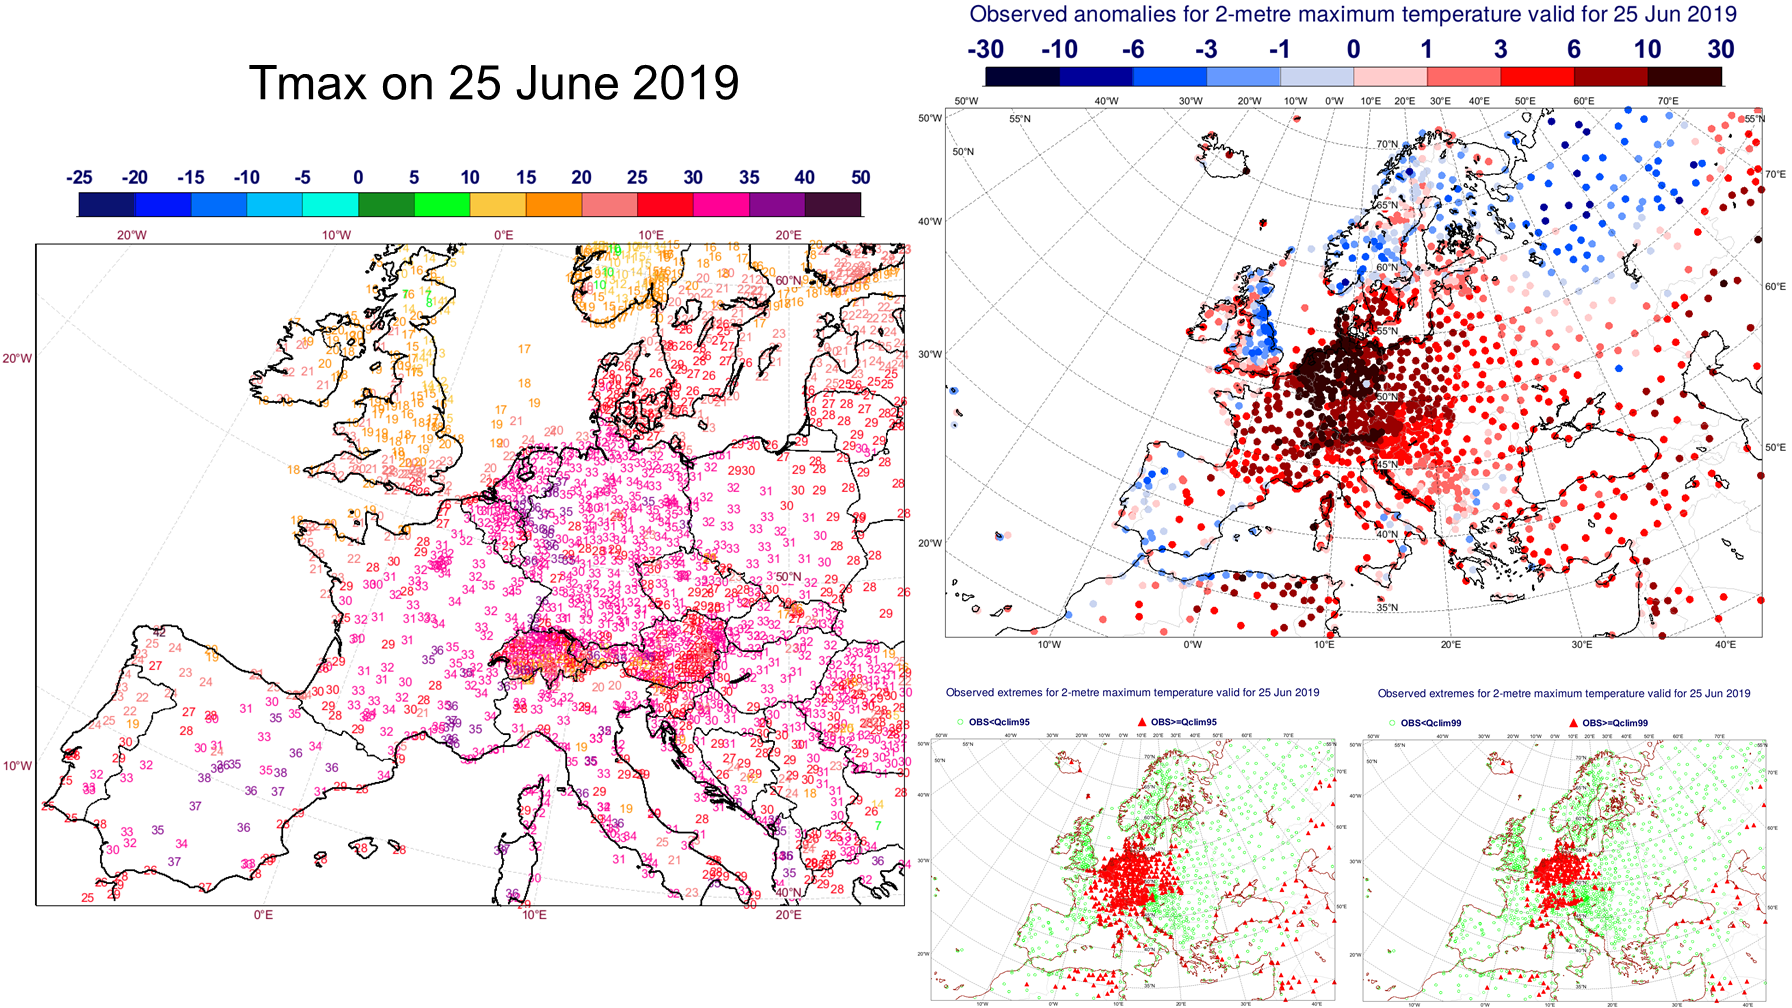
During the last week in June large parts of Western Europe experiences a severe heat-wave. Many June temperature records were broken across western Europe and France set the all-time high temperature with 4546.1 0 degrees in Villevieille Vérargues between Montpellier and Nimes on 28 June.
...
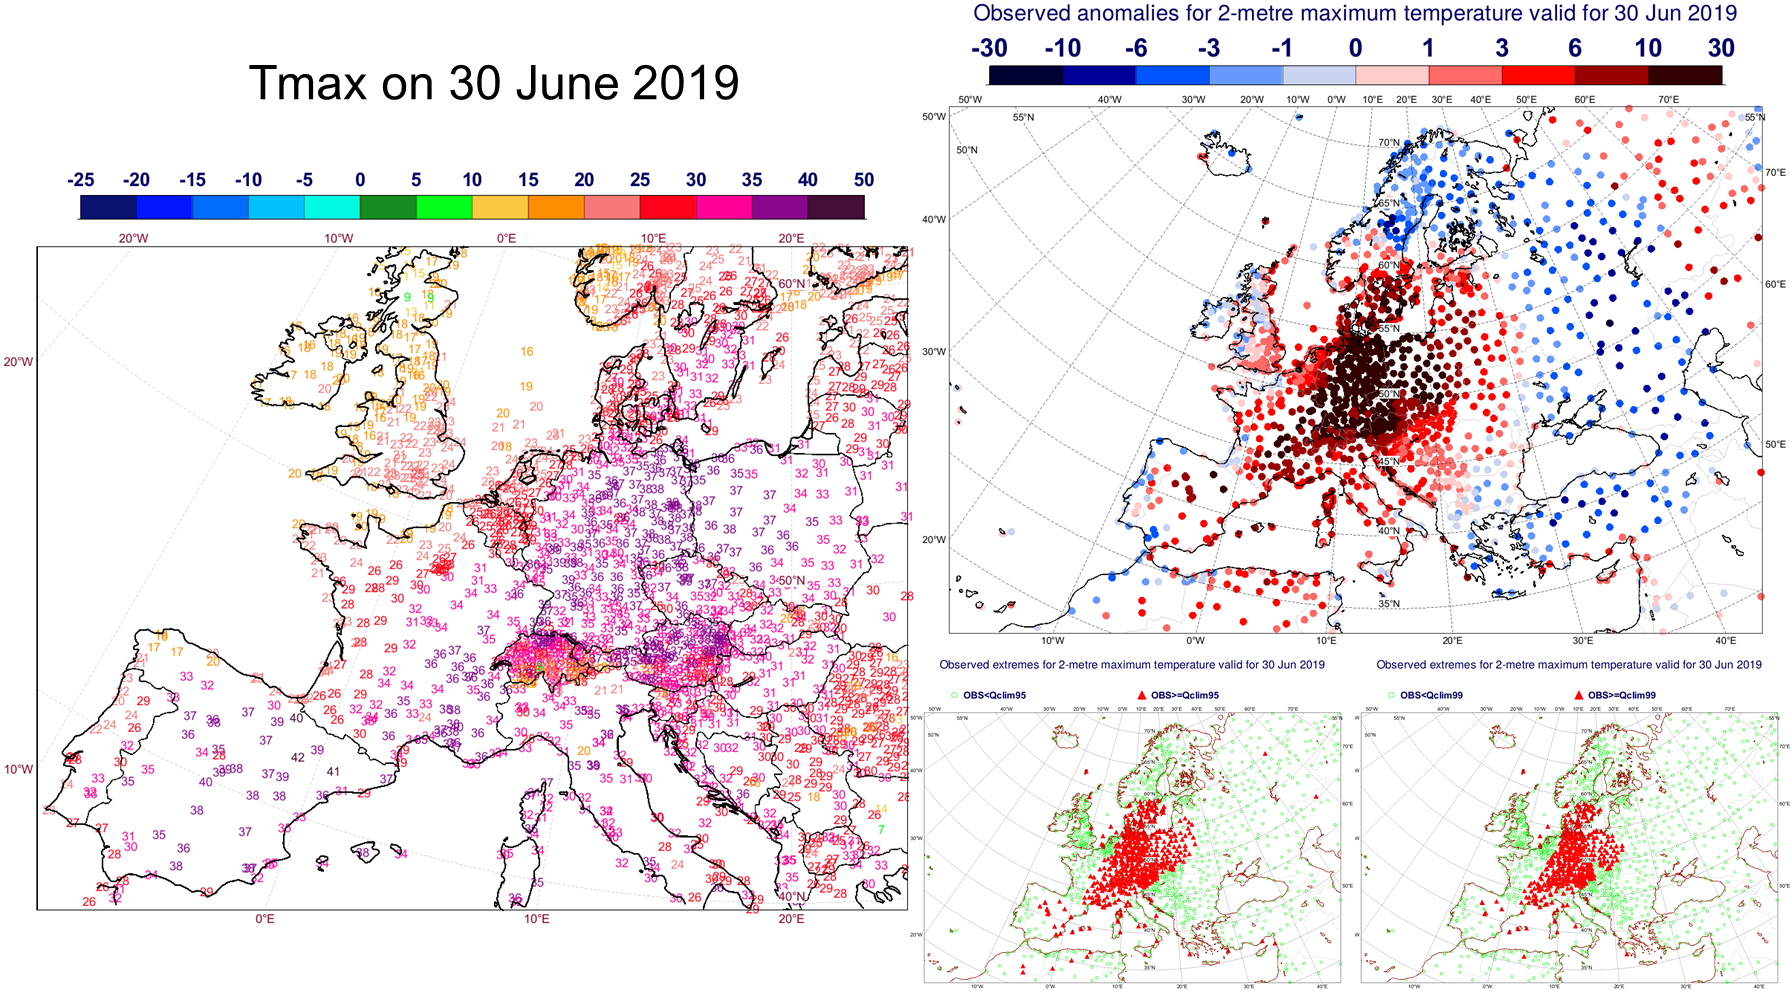
The plot below shows the maximum temperatures during the week of 24-30 June.

The maps below represent daily maximum temperatures for each day in the week of 24-30 June. The heatwave started building up on 24th. On the 25th and 26th it spread over much of western and central Europe. At that time parts of the UK stayed quite cool due to air coming from the cold North Sea. On the 28th (Friday) temperatures in the UK also went up and reached 27-28C in Scotland while there was a short break in the heatwave for central European countries. Saturday, 29th, was the hottest day for England with temperatures higher than 30C in central and southern England. In France and northern Spain temperatures temperatures raised over 40C in some places. On Sunday, 30th, cooler air from the NW gradually put an end to the heatwave.


3. Predictability
3.1 Data assimilation
...
The plots below show EFI and SOT for 3-day temperatures valid 26-29 28 June in forecasts from 26 June (first plot) to 20 June (last plot). All forecasts captured the heatwave.
...
The ensemble ensemble evolution plot below shows the ENS (blue) and HRES (red dot) 3-day average temperature for a box covering most of France (44N-50N,2E-8E) 26-29 June28 July. The signal of the heat appeared quickly between the forecast from 18 June 00UTC to 19 June 00UTC (7 before the start of the verification period). Earlier forecasts had a ensemble median cooler than normal (see Section 3.4).

The plots below show EFI and SOT for the maximum temperature on 28 June, the day when the French record was broken.


The ensemble ensemble evolution plot below shows the ENS (blue) and HRES (red dot) maximum temperature for Nimes on 28 June.
To investigate the difference in the ensemble forecasts from 18 and 19 June further, the plots below show the z200 ensemble mean difference (shade) for pair of forecasts valid the same date, starting from the difference valid 28 June (10 day forecast from 18th minus 9 day forecast from 19th). The following plots show the differences at earlier valid times (increments of one day). On 28 June the difference is clear over Europe. On 24 June (5th plot), the difference is related to a ridge-through-ridge structure over North America and western Atlantic. A guess it that the difference appear in over northern Pacific on 19 June.
...