Status:Ongoing analysisFinalized Material from: Linus, Fernando
Discussed in the following Daily reports:
...
| Show If | ||
|---|---|---|
| ||
1. Impact
| Excerpt |
|---|
On the 27 April 7pm local time (00UTC 28 April), tornadoes hit towns north and west of Little Rock, Arkansas killing approx 17 people (http://edition.cnn.com/2014/04/28/us/severe-weather/index.html?hpt=hp_c2). On the evening on the 28 April fatal tornadoes occurred over Mississippi (http://www.bbc.co.uk/news/world-us-canada-27199071). |
2. Description of the event


The WV satellite image shows an active cyclone located in Colorado with a cold front attached moving eastwards crossing the SE Texas and Arkansas. A very active region of convection is seen ahead of the cold front where most of the severe weather events have been reported.
Gallery includeLabel radar sort comment title RADAR Little Rock
The figures above show the radar from Little Rock from 6pm, 7pm and 8pm.

The picture above show the sounding from Little Rock at 28 April 00UTC, which should be very close in time and space to the worst tornadoes (from Uni. Wyoming). The CAPE calculation from the sounding gave a value of 2115. We also see a strong wind shear in the lower troposphere.
Gallery includeLabel cape_efi_0 sort comment title CAPE EFI 0-24h
The figures above show the CAPE EFI (shades), precipitation (green symbols) and the ensemble mean of z500 (blue contours) valid for the first forecast day. Little Rock is marked with an hourglass symbol. This plots show the evolution of the weather situation. In the beginning of the period a trough moved in from the Pacific, setting up a southerly flow over the mid west. The EFI values for CAPE was the highest during the 28 April.
Radar sequence from weatherunderground.com .
3. Predictability
3.1 Data assimilation

The "rejection charts" highlight a cluster of wind and temp observations with low weight which seems to be related with the strong convective activity in the region. The increment charts at 200 hPa suggest that the observations are trying to "correct" the background even under these conditions.
3.2 HRES


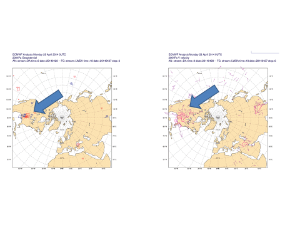
We cannot expect the model to capture tornadoes, but the convective environment. The figures above show the HRES forecast for CAPE (00+23h) and accumulated precipitation +23-24h. Little Rock is marked with an hourglass symbol. For this hour, the maximum precipitation exceeded 20 mm/h). If anything, the area of the strongest convection is shifted somewhat to the west.
3.3 ENS
| Gallery | ||||||
|---|---|---|---|---|---|---|
|
The figures above show the CAPE EFI (shades), precipitation (green symbols) and the ensemble mean of z500 (blue contours) valid for the 27 April Little Rock is marked with an hourglass symbol. The large scale flow situation with a trough over western US was well captured for all lead times, leading to a southerly flow and enhanced risk of high CAPE values.
3.4 Monthly forecasts
3.5 Comparison with other centres
4. Experience from general performance/other cases
5. Good and bad aspects of the forecasts for the event
- We cannot expect the forecast to capture tornadoes, but the convective environment.
- Good forecast of the flow situation in the medium-range
- High 1-hour precipitation values for the 27 April 00UTC run
- The tornado appeared around 00UTC, problem with the EFI accumulation period (00-00UTC)
6. Additional material
- Strong convection and heavy precipitation in U.S continued for a couple of days, see DR
| Show If | ||
|---|---|---|
| ||