Status: Finalised Material from: Ervin, Linus
| Show If | ||
|---|---|---|
| ||
Discussed in the following Daily reports: |
1. Impact
On 29 and 30 April central US was hit by severe convection. There was an intense, slow moving cyclone that causes this. There was several severe weather reports including tornadoes, and at least 5 people died.
http://uk.reuters.com/article/us-usa-weather-idUKKBN17V070
2. Description of the event
The plots below shows the reports of severe weather on 29 April (left) and 30 April (right). Both plots are valid from 12z on the day until 12z on the day after.


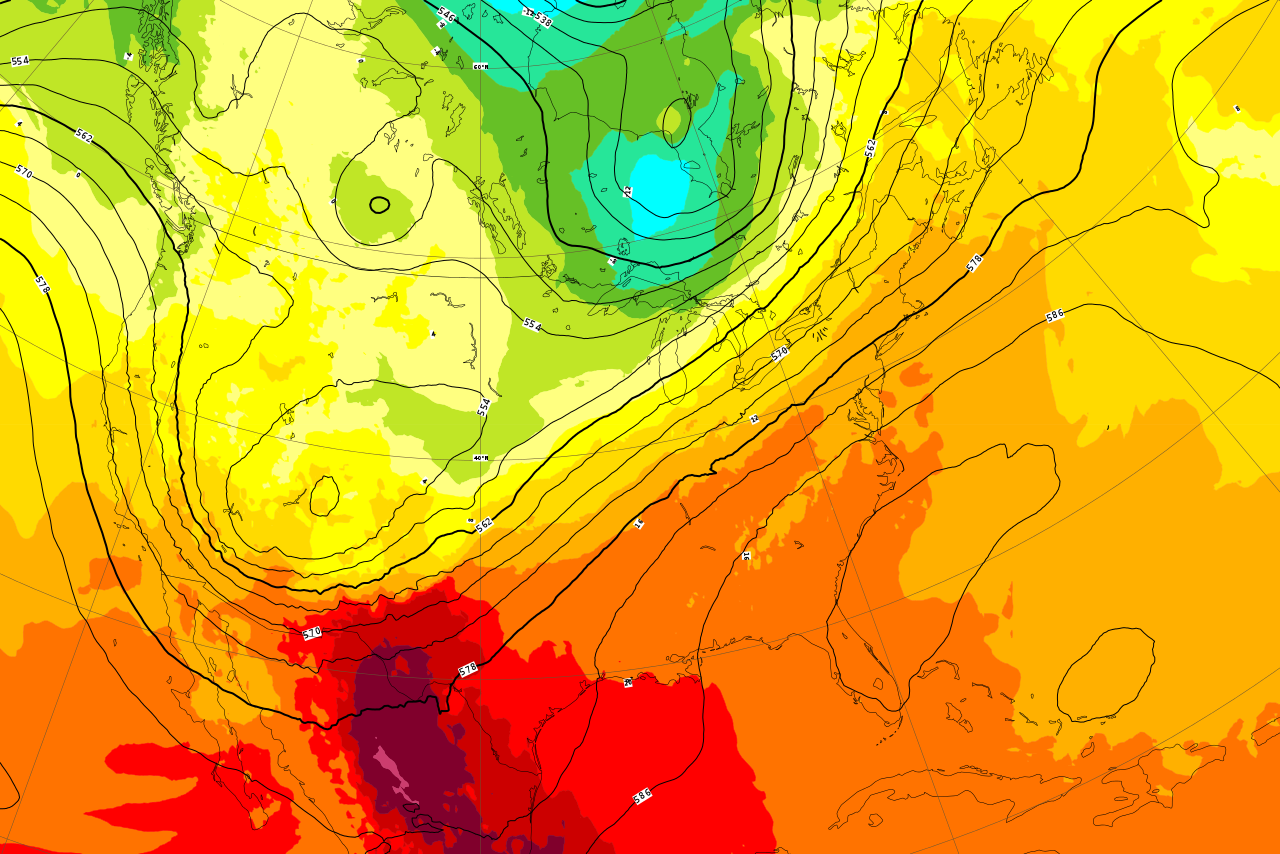
The plots below show analyses of z500 and t850 for 29 April to 1 May.


3. Predictability
3.1 Data assimilation
The plots below show the increment at 200 hPa (left) and 850 hPa (right) for 30 April 09 z (12z cycle). Large increments were needed over the central U.S


Te plot below shows the time-series of 12-hour RMSE for v200 over North America, as a proxy for the area average of the increments. The errors in the forecasts from 29 April were the highest for this season.

3.2 HRES
The plots below show the precipitation on 29 April from NEXRAD (top-left), 1-day HRES forecast (top-right) and 5-day HRES forecast (bottom-left).

The plot below shows the same as above but for 30 April.

3.3 ENS
The plots below EFI and SOT for precipitation valid 29 April (first) and 30 April (second row).


3.4 Monthly forecasts
3.5 Comparison with other centres
4. Experience from general performance/other cases
5. Good and bad aspects of the forecasts for the event
6. Additional material
Status:Ongoing analysis Material from: Ervin, Linus
| Show If | ||
|---|---|---|
| ||
Discussed in the following Daily reports: |
...
1. Impact
On 29 and 30 April central US was hit by severe convection. There was an intense, slow moving cyclone that causes this. There was several severe weather reports including tornadoes, and at least 5 people died.
...
http://uk.reuters.com/article/us-usa-weather-idUKKBN17V070
2. Description of the event
The plots below shows the reports of severe weather on 29 April (left) and 30 April (right). Both plots are valid from 12z on the day until 12z on the day after.
The plots below show analyses of z500 and t850 for 29 April to 1 May.
3. Predictability
3.1 Data assimilation
The plots below show the increment at 200 hPa (left) and 850 hPa (right) for 30 April 09 z (12z cycle). Large increments were needed over the central U.S
Te plot below shows the time-series of 12-hour RMSE for v200 over North America, as a proxy for the area average of the increments. The errors in the forecasts from 29 April were the highest for this season.
3.2 HRES
The plots below show the precipitation on 29 April from NEXRAD (top-left), 1-day HRES forecast (top-right) and 5-day HRES forecast (bottom-left).
The plot below shows the same as above but for 30 April.
3.3 ENS
The plots below EFI and SOT for precipitation valid 29 April (first) and 30 April (second row).
3.4 Monthly forecasts
3.5 Comparison with other centres
4. Experience from general performance/other cases
...