Status:Ongoing analysis Material Status: Finalised Material from: Linus
| Show If | ||
|---|---|---|
| ||
Discussed in the following Daily reports: |
...
The plots below show 24-hour accumulated precipitation 21 December 00UTC to 22 October 00UTC in forecasts with different initial times. The MSLP valid at 21 December 12UTC is included as well. Moderate rainfall (20-30 mm/24h) with possibilities of extreme rainfall was indicated in HRES forecasts from 17 December 12UTC and onwards.


3.3 ENS
The plots below show the EFI and SOT for 1-day precipitation valid 21 December. High SOT values start to appears in the forecast from 18 December north of Sri Lanka, indicating that some members have extreme rainfall.
...
The plot below shows the forecast evolution for 24-hour rainfall on 21 December for a point north of Maankulam, which got more than 300 mm during the day. The blue box-and-whisker shows the ensemble distribution, the red dot the HRES forecast and the red box-and-whisker the climate distribution based on re-forecasts.

3.4 Monthly forecasts
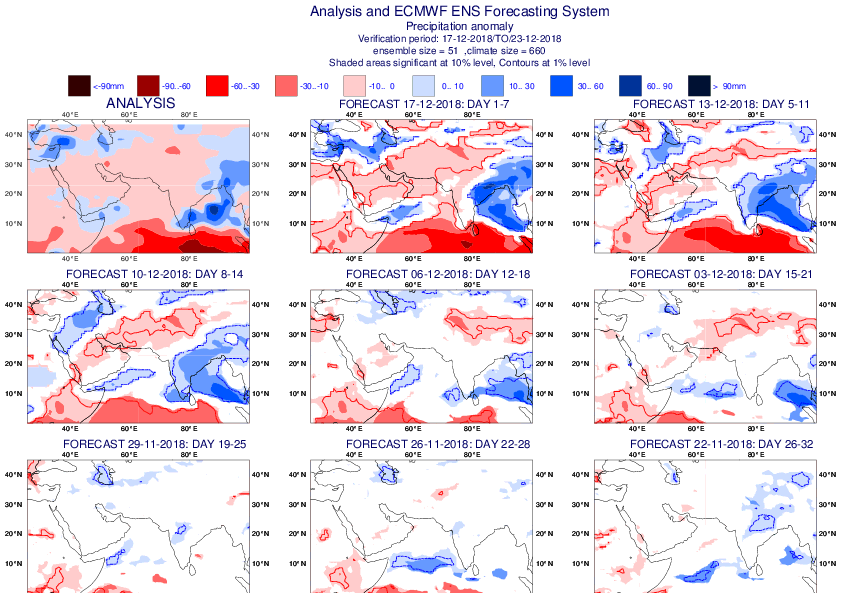
The figure below shows verification of weekly precipitation anomalies for 17-23 December. The first panel shows the anomalies in the analysis and subsequent panels the forecast valid to the same week.
3.5 Comparison with other centres
...