Status:Ongoing analysis Material from: Linus
1. Impact
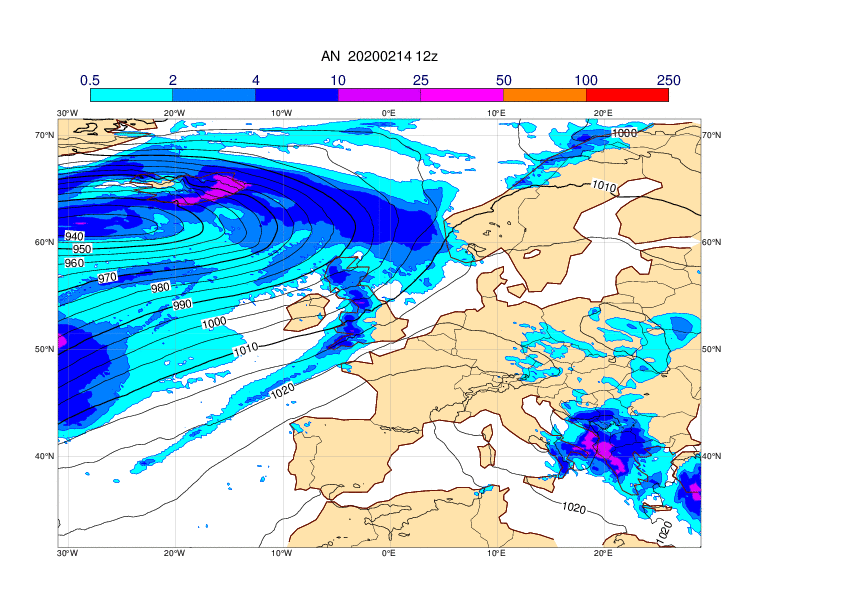
On 15-16 February the storm Dennis affected the north-western Europe. The cyclone centre was located south of Iceland, and reached a pressure of 919.2 hPa according to the 16 December 00UTC analysis. The cyclone caused widespread flooding in Wales and southern England together with strong winds. The cyclone also led to heavy rainfall in Denmark and southern Sweden where rivers started to flood, as the water levels were already high after Storm Ciara.
2. Description of the event
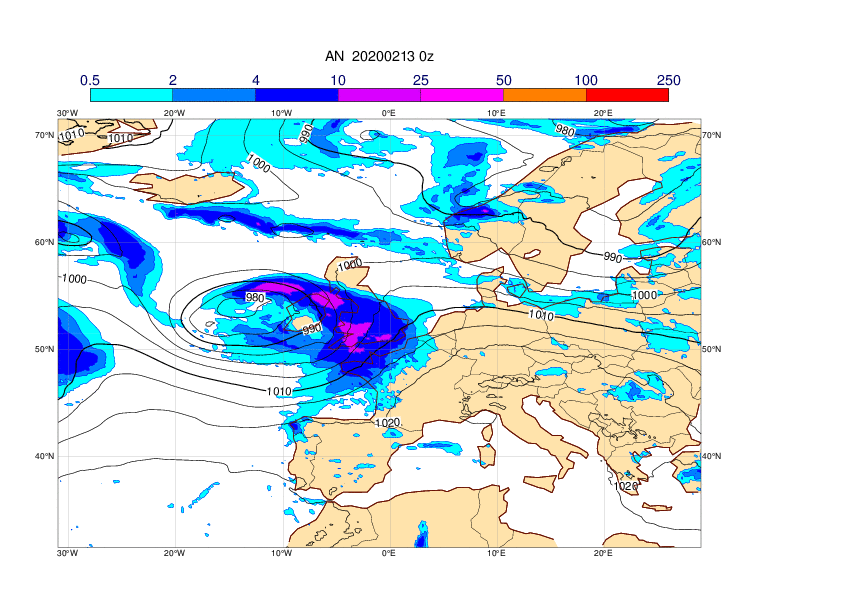
The plots below show analyses of MSLP and 6-hour precipitation forecasts every 12h hour between 13 and 17 February.


The plots below show analyses of z500 and t850 every 12h hour between 13 and 17 February.


3. Predictability
3.1 Data assimilation
3.2 HRES
The plots below show observations of 24-hour maximum wind gusts valid 15 February 12UTC to 16 February 12UTC (first plot) and HRES forecasts valid at the same period. The forecast plots also includes MSLP valid 16 February 00UTC (grey contours).


The plots below show observations and forecasts of 24-hour precipitation valid from 15 February 06UTC to 16 April 06UTC. The forecast plots also includes MSLP valid 15 February 18UTC.


3.3 ENS
The plots below show EFI and SOT for wind gusts valid 15 February.


The plots below show EFI and SOT for total precipitation valid 15-17 February.


The plots below show EFI and SOT integrated water vapour flux valid 15-17 February.
To come
The plot below shows the evolution of forecast for 24-hour total precipitation valid 15 February 00UTC to 18 February 00UTC for a 2x2 degree box over Wales outlined in the precipitation plots above. The plot includes ensemble (blue box-and-whisker), HRES (red dot) and model climate (red box-and-whisker).
