Status:Ongoing analysis Material from: Mohamed, Linus
Picture
1. Impact
2. Description of the event
The plots below show the estimates of maximum wind speed and central pressure from different sources (from http://tropic.ssec.wisc.edu/tropic.php# )

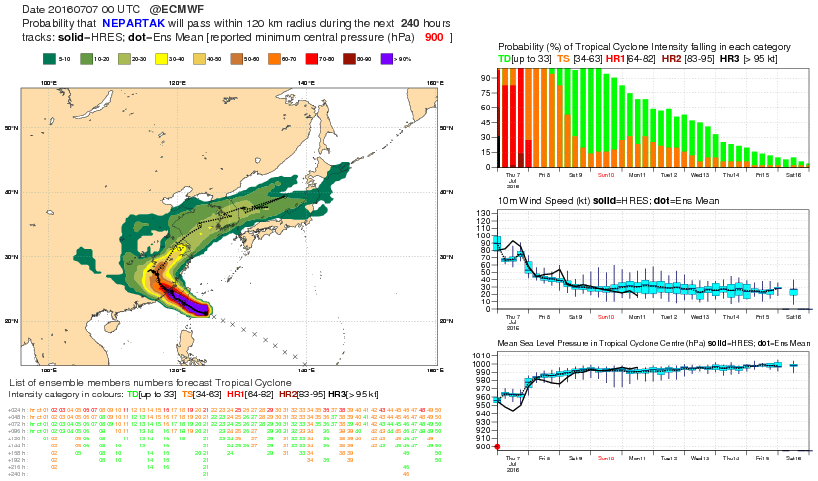
During its most intense phase the cyclone passed over a moored research buoy, which measured ~900 hPa.

Below you can find a video of satellite images. Plese note hte gravity wave pattern that radiates out from the cyclone centre.
 160705_himawari8_infrared_Typhoon_Nepartak_anim.mp4
The animation below show animated sequence of high-resolution visible imagery from a new Chinese civilian geostationary satellite Gao Fen 4 (GF-4). (Provided by Chris Velden.)

3. Predictability
3.1 Data assimilation
3.2 HRES
3.3 ENS
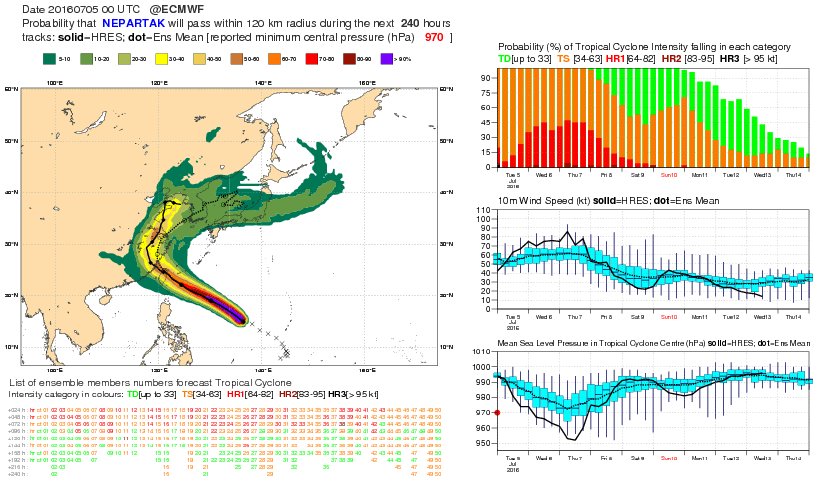
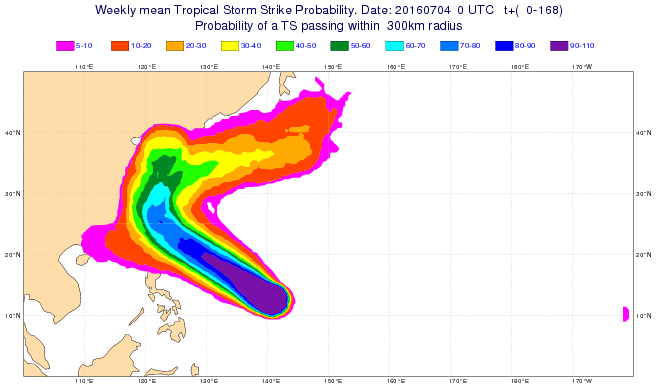
The plots below show the tropical cyclone product for Nepartak.


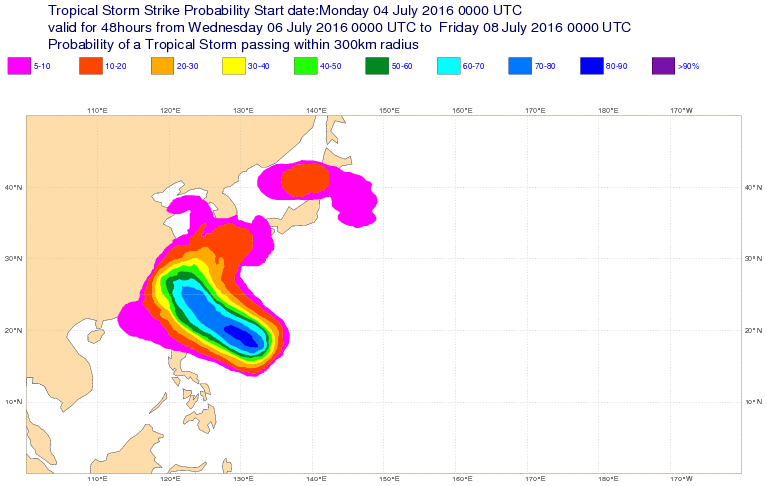
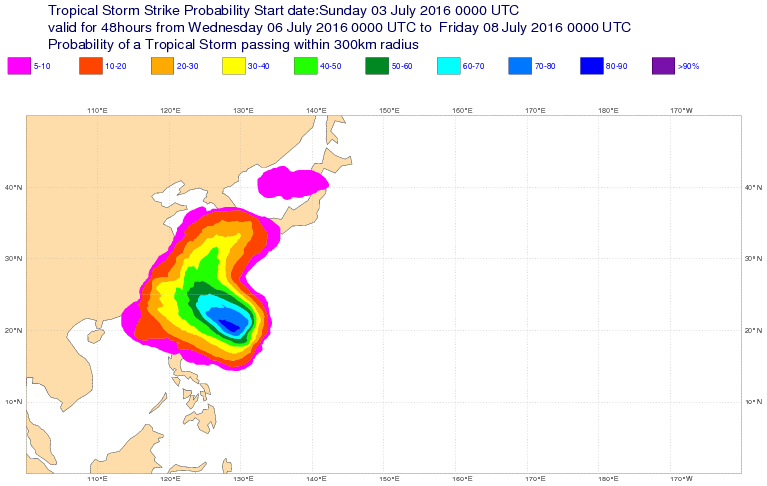
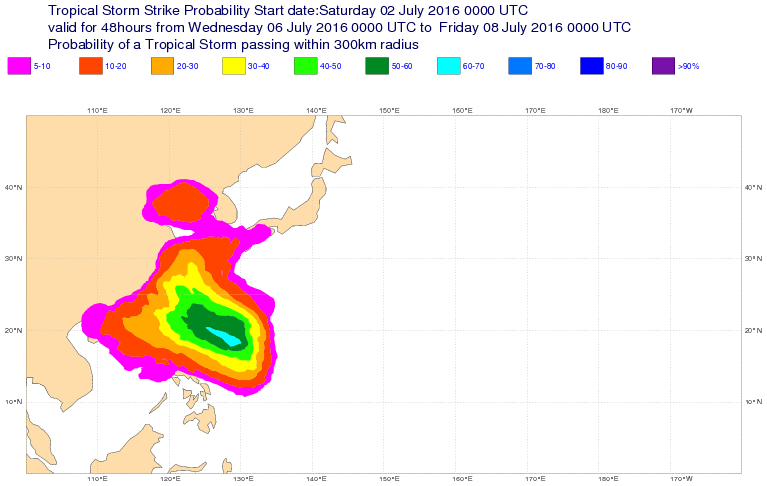
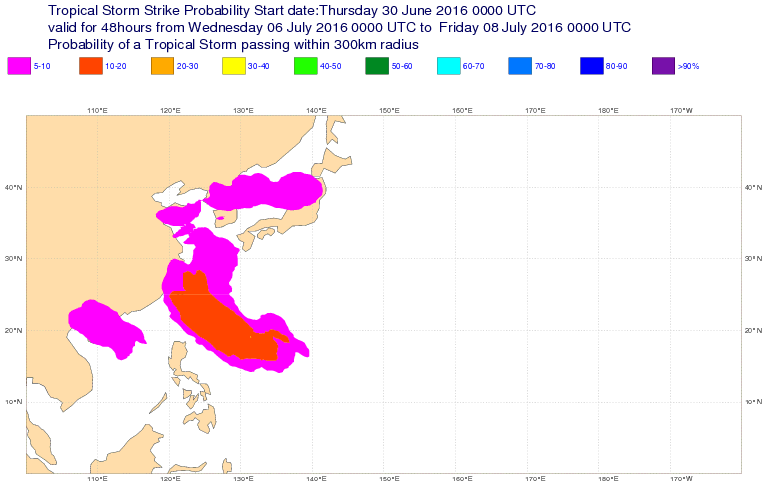
The plots below show the tropical storm activity for 6-8 July.


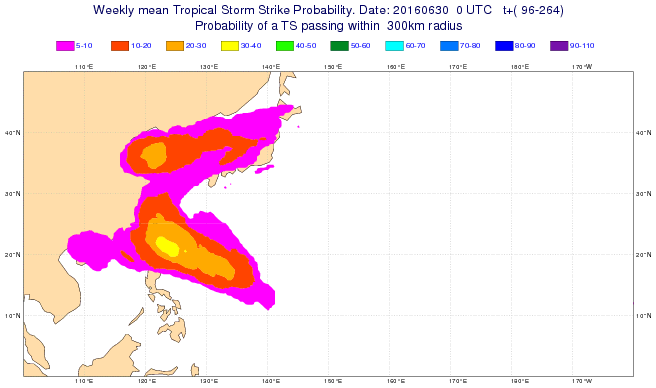
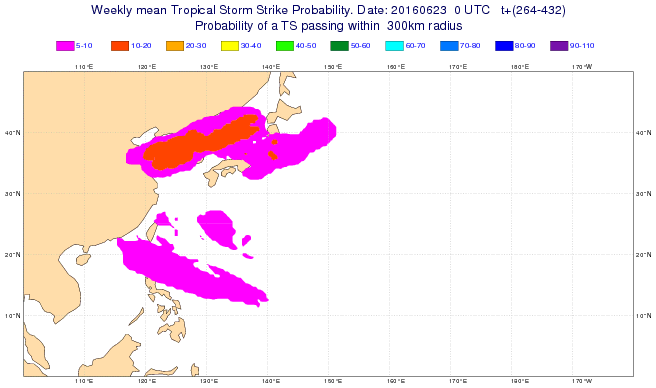
3.4 Monthly forecasts

3.5 Comparison with other centres
4. Experience from general performance/other cases