What is Geopoints?
Geopoints is Metview's own format for storing irregularly distributed geographical data (typically observations). A geopoints file is an ASCII file containing a header section and a data section consisting of several columns, so it can be regarded as specialised CSV (Comma Separated Values) file.
There are some different 'flavours' of the format, described below.
The Geopoints icon
Geopoints files are represented by this icon in the user interface:
![]()
Examining Geopoints contents
The contents of a Geopoints file can be inspected with the Geopoints Examiner, which can be started up from the user interface (right-click examine on the icon).
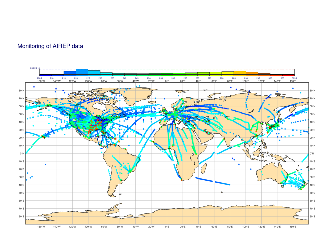
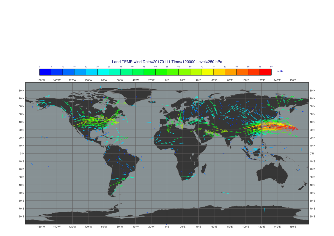
Visualisation on maps
Geopoints can be directly visualised in Metview on a map view. In the user interface just right-click visualise on the icon to get a plot with the default settings. These plots can be further customised with Symbol Plotting (scalar values) and Wind Plotting (vector values) icons.
Geopoints and BUFR
In Metview the typical way to handle BUFR data is to filter it into a Geopoints file using the Observation Filter and the Bufr Picker icons. The resulting data is then visualised or further processed with Metview's rich Geopoints API.
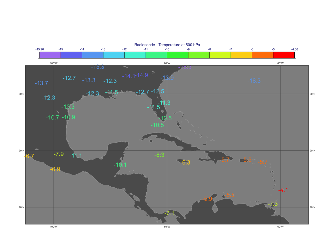
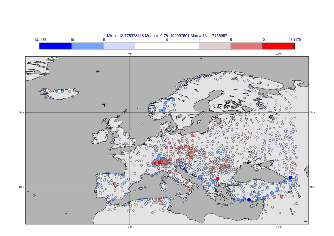
Operators for GRIB and Geopoints
It is atypical scenario in Metview that we have forecast data in GRIB format and some corresponding observations in Geopoints (probably filtered from BUFR) and we want to compute the difference between them. Using Metview's script interface it can be done in a single line like this (supposing g is a fieldset while gpt is a geopoints object):
gpt_diff = g - gpt
For a full fledged example click the image below.
Conversion between Geopoints and GRIB
A GRIB fields can be directly exported into Geopoints using the Grib To Geopoints icon. The other direction is also possible with the Geopoints To Grib icon, which offers various interpolation techniques to compute the grid point values from the values available at scattered locations.
Script language support
Metview provides full support for Geopoints from its Macro and Python interfaces.
The list of available functions for Geopoints can be found on the Geopoints Functions page.