Preparation
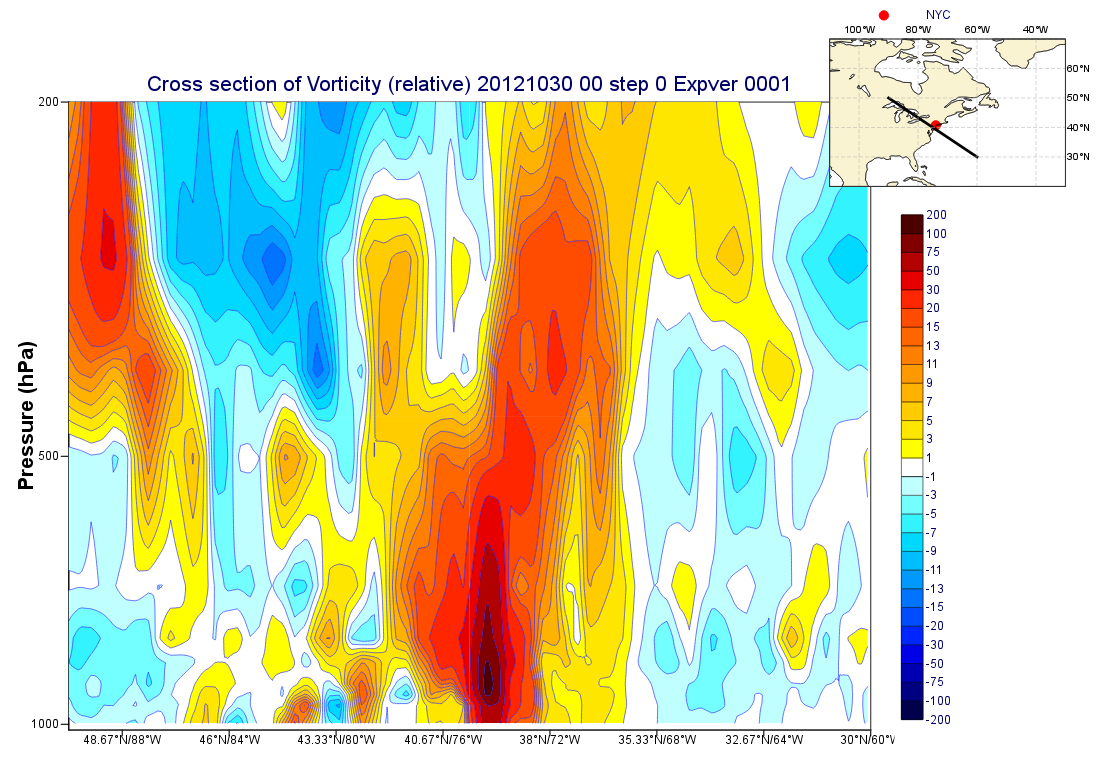
In this exercise we will produce a cross section plot of relative vorticity through Hurricane Sandy. We will also create a more interesting layout which will include a geographic map showing the path of the cross section line.
XXX Download data
Verify that the data are as expected.
We will prepare the plot interactively using icons. Then, at the end, we will put it all together into a macro. Remember to give your icons useful names!
It's probably easiest to prepare the cross section and the map separately, then bring them together at the end.
Plotting the Cross Section
Use a Cross Section View icon with a logarithmic scale vertical axis.The transect line should go from XXX to XXX.
To add the title label "Pressure (hPa)", customise an Axis Plotting icon and drop it into the appropriate place in the Cross Section View icon's editor.
Devise your own colour scale with a new Contouring icon, or else use the pre-prepared one in the Solutions folder.
Use a Legend icon to move the legend to the right-hand side of the plot as shown.
Plotting the Map
Use a Geographical View icon to define the map. The map area should be XXXX and should show the line of the cross section - use an Input Visualiser icon coupled with a Graph Plotting icon to achieve this. The location of New York City (XXXX) can also be added with another Input Visualiser icon coupled with a Symbol Plotting icon. The legend will look better if customised to use the Disjoint type.
A feature which will make the map overlay better with the cross section plot is to remove the labels from its left and bottom axes (via a Coastlines icon).