The Dashboard is a place to organise regularly used charts and diagrams and builds on the functionality of the Your room facility that was available on old web site.Dashboard link is available under your username;

Charts can be arranged as desired to facilitate easy viewing on the same page.

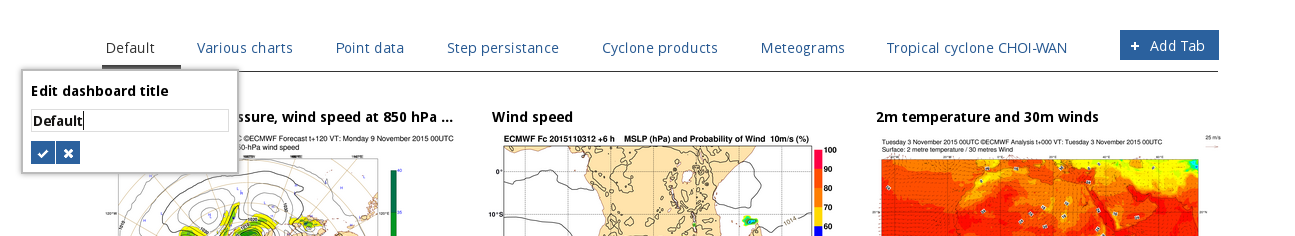
The charts are arranged in a set of folders arranged as tabs at the top. Tabs can be added, removed and renamed. Currently, each tab has a fixed 3 column layout.
Charts are added to dashboard from chart pages. Use the drop-down menu on the right hand side of the parameter menu.

In dashboard, Charts are contained in "widgets" that can be added, removed and modified. Hovering over the widget title will display a title bar that can be used to drag and drop the widget to a desired position on the page. Widgets can be moved to different tabs by dragging and dropping them over the tab name that you wish to move to.

Larger previews of the product are available by clicking on product thumbnail. This preview page displays the product together with controls such as base time, step and area. Any changes made on preview window is saved back to the widget.
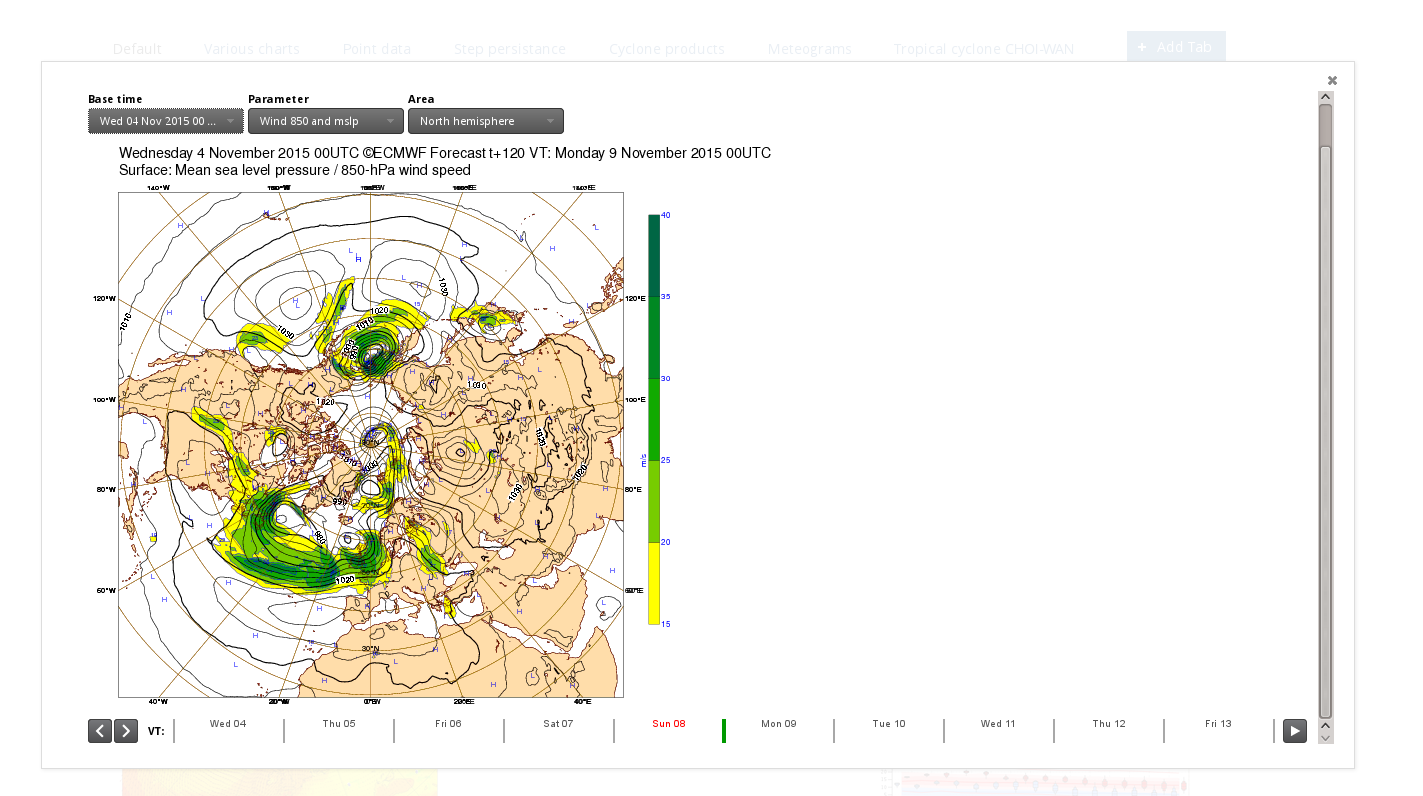
Current behaviour of dashboard is to save charts on their view state. When a chart is added to dashboard, it will keep its initial state (base time, step, area ...). Preview window is the way to change the state. Note that because of this behaviuor, charts are not updated to their latest forecast base times automatically. This is subject to change based on the feedback we receive from users.