-
Created by
 Linus Magnusson, last updated on Apr 01, 2025
13 minute read
Linus Magnusson, last updated on Apr 01, 2025
13 minute read
Status:Ongoing analysis Material from: Linus, Esti, Tim
1. Impact
On 29 October the region inland of Valencia was hit by very extreme rainfall, causing terrible flash floods. At least 232 people lost their lives.
Citation from BBC 1 Nov:
""
The death toll at the moment still stands at 158, but officials are saying that many dozens are missing.
So it's a mixture of rescue work - people still hunting for survivors perhaps, but the dead particularly - and also the grim task of clearing up the mud which cakes everything. It's also a task of supporting families who have lost so much because of the torrential rain.
Today, it's a clear morning, there are only some clouds in the distance. Yet that’s exactly the problem; the rain came elsewhere and people in Valencia were taken totally by surprise because they didn't see the rain and they didn't anticipate the flash flood coming down the rivers so fast.
This is where public education has to change, and has to play such a role.
People need to understand that it doesn't need to rain where you are for there to be a very dangerous flood. People need to be told, they must not get in their cars, which may be the natural thing to do.
As we've seen those cars become death traps on clogged undriveable roads. People need to know that they need to go to higher ground and they need to know where that higher ground is.
Although there were warnings, they clearly didn't carry the urgency that they needed to.
""
2. Description of the event
The evaluation of the rainfall will focus on 24-hour rainfall on 29 October 00UTC - 30 October 00UTC in a 025x0.25 box centred on Chiva, 20 km west of Valencia (39.5N, 0.8W,).
The plots below show analyses of MSLP and 6 hour rainfall from 27 October 00UTC to 30 October 00UTC, every 12th hour.


The plots below show analyses of T850 and z500 from 26 October to 30 October.


Observation maps available on social media the day after the event. On the right, gridded analysis of the 24h precipitation where all the SYNOP stations are included (provided by AEMET)


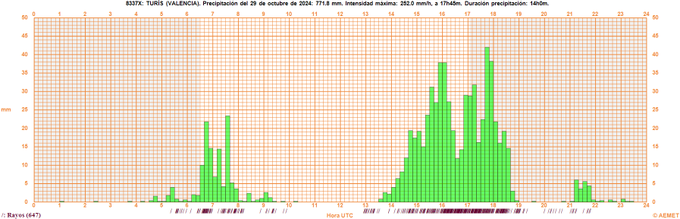
Some time after the event, AEMET released a new measurement in Turís Mas de Calabarra of 771.8 mm/24h, surpassing the 491 mm/8h recorded in Chiva (north of Turís)
Resource: https://x.com/AEMET_CValencia/status/1854152815637066193
•The meteorological event:
–A combination of warm and moist air in the lower levels and cold air in mid-level, causing a conditional instability
–Convection triggered by the orographic lifting.
–Maintained by the lower level winds, and the vertical wind shear probably played a role.

Detailed analysis of the event in this article by ESSL: https://www.essl.org/cms/meteorological-analysis-of-extreme-flash-flood-situation-in-the-valencia-region/.
3. Predictability
3.1 Data assimilation
3.2 HRES
The plots below show 24-hour precipitation in observations (first plot, to be added), concatenated short forecasts (second plot) for 29 October 00UTC to 30 October 00UTC. Note that there are more observations from AEMET (add plot). For example is Chiva (447 mm) missing in the current coverage.


The plots below show 24-hour precipitation in ENS control forecasts with different lead times.


The plots below show 24-hour precipitation in DestinE 4.4km with different lead times.


The plots below show 24-hour precipitation in AIFS with different lead times.


The plots below show 24-hour precipitation in AIFS-ENS (diffusion model with 1 degree resolution) member 1 with different lead times.


The plots below show the 24h precipitation forecast at different lead times for HRES (top) and DestinE 48r1 (middle) and DestinE 49r1 (middle) forecasts valid on the 30th October 2024 at 00 UTC.


The plots below show the 24h precipitation forecast at different lead times for the reduced cloud based mass flux at 4.4 km forecasts valid on the 30th October 2024 at 00 UTC.


3.3 ENS
The plots below shows EFI and SOT for 1-day precipitation (29 October).


The convective environment was characterised by high CAPE and high shear resulting in high values of the CAPE-shear index. The plots below show the operational forecasts of the EFI and SOT for CAPE-shear.


The plot below shows the forecast evolution plot for 24-hour precipitation for Chiva (split in two figures to fit all forecast types). For AIFS and AIFS-ENS, nearest gridpoint was used instead of area average due to low model resolution.
Observation - green hourglass
Analysis - green dot
ENS control–red
ENS - blue box-and-whisker
AIFS - cyan dot
Desint4.4km - evergreen dot
AIFS-ENS - grey box-and-whisker
cy49r1 ENS - purple box-and-whisker
Model climate – cyan box-and-whisker
Ensemble mean as black diamonds. Triangle marks the maximum in the model climate based on 1800 forecasts.


The plots below show hit (green), misses (purple) and false alarms (cyan) of predicting precipitation above the 99th percentile of model climate, based on the ensemble median.


ecPoint
The two animations below compare forecasts from the raw ECMWF Ensemble with forecasts from the ecPoint post-processed version of that, for thresholds, respectively, of 150 and 300mm/12h. Probability of exceedance in percent is shown. Turis, where 666mm were provisionally recorded during this period, lies 10km south of the middle of three black markers (which is itself at the site of Chiva where very high totals were also registered).
The raw ENS forecasts provided good guidance here from 4 days in advance, albeit with a large underestimation versus the point values. That said there is some jumpiness in the locations forecast to be at greatest risk. And there is also some temporal jumpiness probability magnitudes, with for example a big jump to lower probabilities apparent between the last two forecasts issued.
In relative terms the ecPoint forecasts are spatially and temporally more consistent, with the area south of the middle black dot shown to be at highest risk throughout. Plus this is for a higher threshold rather closer to what was observed.
The third (static) graph plot shows a time sequence of the maximum 99th percentile ecPoint value seen over the broader Spain area, in the 5 days leading up to the event. The peaks were all in the general vicinity of Turis. Here we again see consistency in ecPoint forecasts, and a signal that grows in magnitude with shorter lead times, which is what one would expect as confidence grew and the spread of the driving raw ensemble reduced somewhat. In the last two forecasts values are very close to the Turis observation, albeit that this still represents a low probability within the gridbox. Against that we have selected the wettest known place to verify against, and note also that, not far away, in Valencia itself, less than 10mm rainfall was recorded in this period, so huge local variability.
The adjacent map plot shows an estimate from the ERA5-ecPoint product, of the 200-year return period of 24h rainfall (this comes from the ecPoint probabilities, and as such is a non-parametric estimate, so no "tail fitting" is involved). The Turis area value is shown with a black line on the graph - evidently all the 99th percentile ecPoint forecasts in the lead up showed well above this value.

Raw ENS probabilities of >150mm/12h (valid time 06-18UTC 29th October 2024), from successive forecasts, at 12h intervals, from 25 Oct 00UTC to 29 Oct 00UTC (see titles)

Same as Raw ENS animation above, but output is from ecPoint, for a higher threshold: >300mm/12h.

Graph shows the maximum of the 99th percentile ecPoint field in forecasts leading up to the event (over Spain, but always, in practice, close to Turis). The map shows a 200-year return period estimate for 24h gauge-based rainfall totals from ERA5-ecPoint (data from 2000-2019).
It has been noted that the standard 99th percentile value from ecPoint forecasts might be construed as too low a probability to justify assistance with warning issue (even if forecasts are consistent). This motivated a re-investigation of the ecPoint output, which can be presented in different ways. An alternative presentation option is shown below:

Comparison of two ecPoint-related products (see text) from the same data time (12UTC 25th October 2024), valid for 12h rainfall totals on day 4 (06-18UTC 29th October 2024)
For this we take the 99th percentile point rainfall value from each of the 51 ensemble members, just after the first stage of post-processing where members will have been dealt with individually. Via the assumptions underlying ecPoint post-processing these values are taken to represent the likely maximum value, within a given gridbox (here 18km scale), were that member's synoptic pattern to verify, and if one had 100 evenly spaced measurements in that gridbox. These 51 member 99th percentile values are then ranked, and from this ranking we can select and plot the median, for example, and then state that "there is a 50-50 chance of this value being exceeded somewhere within the gridbox". Such an approach has parallels with other neighbourhood-type post-processing approaches applied to limited area ensemble output, used for example at the Met Office in the UK to give the maximum likely rainfall value within a region. The day 4 forecast example plot above shows a general reduction in values with the new representation, as expected, although notably the extremes are largely "preserved" in the Valencia region. This will be due to relatively high inter-member consistency in that region.
We can then do the same as this for all relevant lead time and then adapt the ecPoint graph plot shown above to include also profiles for this new output, and indeed another related version where, instead of taking the median, we take the 10th percentile, to give a higher confidence forecast of exceedance somewhere in a gridbox. The revised ecPoint output (pink line) has comparable values to the pre-existing method (blue), albeit with a slightly steeper rise with lead time overall. Meanwhile the smaller quantile (10%) of the ranked 99th percentiles suggests high confidence of localised, dangerously high (if not catastrophic) values, say 200mm/12h, from 25th onwards (4 days in advance).

Different ways of representing ecPoint forecasts' post-processed output, for localised extreme rainfall, versus the 12h rainfall observation from Turis
3.4 Monthly forecasts
The plots below show forecasts of weekly precipitation anomalies for 28 October - 3 November.


The plots below show forecasts of weekly z500 anomalies for 28 October - 3 November.


3.5 Comparison with other centres
4. Experience from general performance/other cases
•Such events happens now and then in the Mediterranean region, compare with e.g a case from Italy in 2015 (ECMWF Newsletter 146), and Cat 2 events in Grazzini et al. classification
5. Good and bad aspects of the forecasts for the event
•No signal beyond 1 week
•From ~23 October a wet signal relative to model climate started to appear
•From ~24 October member were sticking up far above the model climate maximum
•From ~26 October, ensemble median similar to model climate maximum
•Ensemble median around 125 mm/24h is the shortest forecasts, compared to 450 mm in the worst observation
•EcPoints top percentiles reached the magnitude of the worst observation
6. Additional material
The plots below show the 24h precipitation forecast at T+48h lead time for the reduced cloud based mass flux at 4.4 km forecasts valid on the 30th October 2024 at 00 UTC.