Status:Ongoing analysis Material from: Tim, Mohamed, Linus
Discussed in the following Daily reports:
http://intra.ecmwf.int/daily/d/dreport/2015/12/21/sc/
http://intra.ecmwf.int/daily/d/dreport/2015/12/22/sc/
http://intra.ecmwf.int/daily/d/dreport/2015/12/28/sc/
http://intra.ecmwf.int/daily/d/dreport/2015/12/29/sc/
Picture
1. Impact
During the Christmas week the northern parts of the British Isles were hit by floods. The worst affected areas were in N England, from Lancashire across to Yorkshire, with the cities of Manchester, Leeds and York all featuring in reports, as well as southern Scotland.
2. Description of the event
The plots below show observations of 24-hour precipitation for the Christmas week 2015.


After several episodes of heavy rainfall, the ground was already saturated when severe rainfall hit on Christmas Day and Boxing Day. The rainfall was connected to a cyclone moving from south-west (see animation below).
The red arrow on the first frame of the animation shows schematically the rough trajectory of low level airmasses in the warm sector associated with low A. This warm, moist airmass seems to have fuelled the rain. SSTs, in what appears to be the approximate source region, NW of Morocco, are about 18-20C. From this region to the UK SSTs were about 0.5C above average.
Trying to disentangle the behaviour of lows/frontal waves during this event is difficult, though it is clear that one or more slow moving frontal zones lay over or just to the north of the main affected areas, and after low A had reached N Ireland, as a much 'weaker' feature, it seems that a new low formed as a wave, of sorts, on a cold front to the SW (labelled low B) and this then deepened for a while as it cross Ireland and S Scotland, becoming a small and quite intense low over the N Sea, before it too filled (after the period shown on the above animation) as it continued on ESE'wards into continental Europe.
So the deepening of low B must have been associated with broadscale dynamical uplift, and that broadscale ascent, together with the close proximity of the frontal zone, the slow moving nature fo the front due to multiple lows/wave movng along it, the warm airmass source region near Morocco, and some orographic enhancement seem to have all contrived, together, to deliver the high rainfall totals observed.

3. Predictability
3.1 Data assimilation
The animation below shows the observation rejection (low weight) charts for subsequent assimilation cycles. Wind observations with low weight is marked with symbols and the 250 hPa wind speed in the analysis is plotted with shades. The position of low A is marked with a black dot. On 23-24 December a cluster of observations were given low weight over U.S, probably connected to severe convection.

3.2 HRES
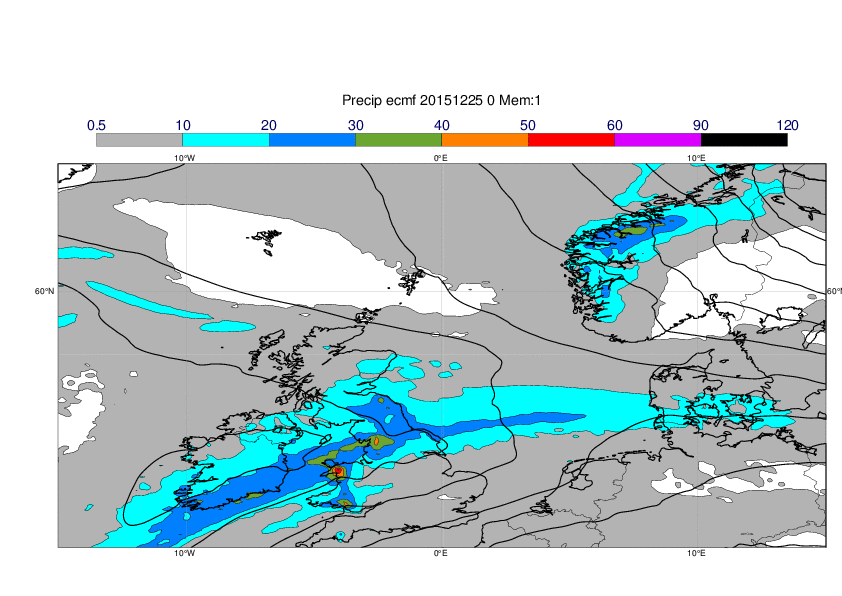
The plots below shows the accumulated precipitation between 25 Dec 06z and 26 Dec 06z.
O-suite:


E-suite:


The plots below shows the accumulated precipitation between 26 Dec 06z and 27 Dec 06z.
O-suite:


E-suite:


3.3 ENS
The following animation shows the 3-day ppn total EFI, for Fri/Sat/Sun, at reducing lead times (we do not compute a 2-day rainfall EFI).

The next plot shows 24h Ppn CDFs for a location in central N England.

There is a modest EFI signal early on, which becomes weaker, before suddenly reasserting itself just before the event. This would have hindered rather than helped forecasters, particularly in the medium range where we are relied upon most for gudiance. This impression is echoed somewhat by the CDF plot, which jumps to higher totals in the penultimate (Fri 12Z = purple) forecast.
The plot below shows Dalmatian charts from successive forecasts for VT 12Z Sat (26 Dec), showing cyclonic features, coloured in by MSLP. We see a clear ensemble jump between the 12Z Thu and 00Z Fri forecasts. Prior to the jump the vast majority of forecasts continued to deepen low A, and took this past NW Scotland, an evolution that would have markedly reduced the duration of rainfall over N England (even though intensity might have been the same, or for a short period higher). In these forecast low B didn't exist or was very muted. In the later batch of forecasts low B deepens, and takes over, and low A is sumsubmed by this development and loses its identity.

3.4 Monthly forecasts
The plots below show the weekly anomalies of precipitation and MSLP valid for the week 21-27 December. For all lead times a positive NAO pattern is visible in the MSLP and wet anomalies for north-western Europe.


The plots below shows ensemble mean seasonal forecasts anomalies for December. The plots include precipitation (shade) and surface wind anomaly (arrows).


3.5 Comparison with other centres
3.6 EFAS
4. Experience from general performance/other cases
5. Good and bad aspects of the forecasts for the event
- Early signal in monthly (and seasonal forecasts) for a wet anomaly in December
- Problems with the details of the cyclone development on 25-26 December led to errors in the precipitation pattern also in the short-range (>24h)
- Underestimation of the magnitude of the precipiation in both o-suite and e-suite