Status: Finalised Material from: Linus, Mohamed
1. Impact
On 1-2 January a cyclone moved over the Nordic countries and caused heavy precipitation along the Norwegian coast and strong winds over North Sea, Gulf of Bothnia and Baltic Sea. According to FMI was it the strongest windstorm recoded in the country with 32.5 m/s on Bogskar in mean wind and 42.6 m/s in the gusts. The wave height reached almost 8 metres along the Finnish coast. A lot of household lost the electricity in the eastern part of Sweden. The wind could have played a role in a devastating train accident on the bridge over Great Belt (Denmark) killing 6 people.
2. Description of the event
The plots below show analyses of MSLP and 6-hour precipitation forecasts.


The plots below show analyses of z500 and t850.


3. Predictability
3.1 Data assimilation
3.2 HRES
The plots below show observations of 24-hour maximum wind gusts valid 1 January 12UTC to 2 January 12UTC (first plot) and HRES forecasts valid at the same period. The forecast plots also includes MSLP valid 2 January 00UTC. The forecast captured well the magnitude on the Baltic side but underestimated the wind gusts on the North Sea side.


3.3 ENS
The plots below show EFI and SOT for 24-hour maximum wind gusts valid on 2 January (we are only producing EFI for 00UTC-00UTC). The risk for high wind gusts on the Baltic Sea was well captured in forecasts from 28 December and onwards (5-6 days in advance).


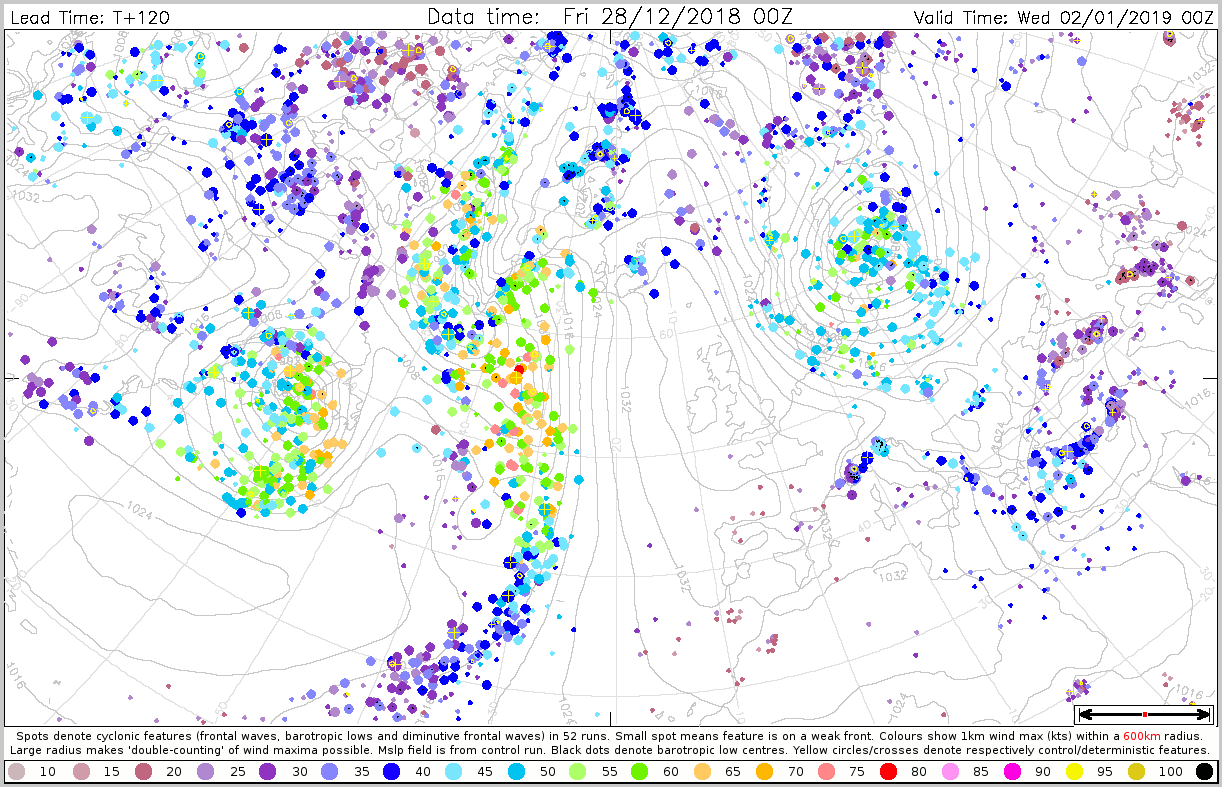
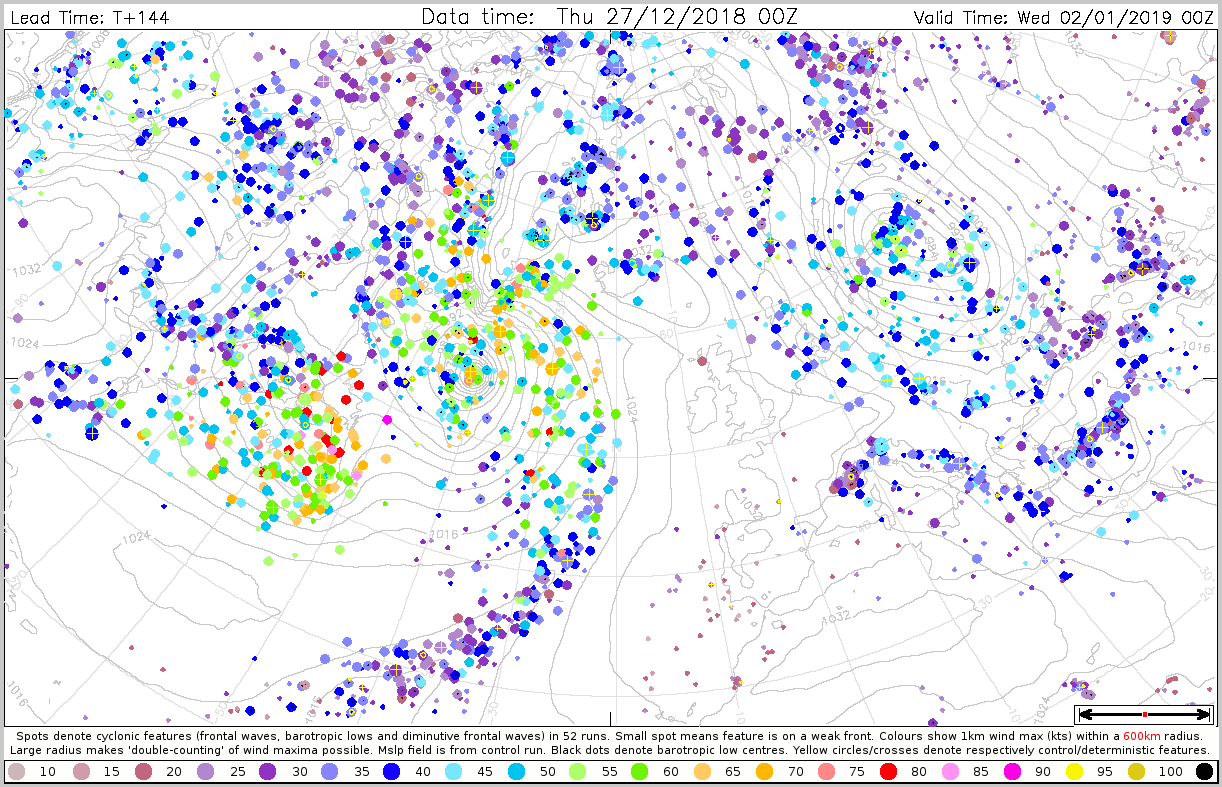
The plots below show cyclone feature plots valid 2 January 00UTC and where the colour represents the maximum wind within a 600 km radius.


The plot below shows the evolution of forecast for 24-hour maximum wind gusts (1 January 12UTC to 2 January 12UTC) for Svenska Hogarna (59.5N, 19,5N), where the maximum gusts reached 37.2 m/s. The plot includes ensemble (blue box-and-whisker), HRES (red dot) and model climate (red box-and-whisker). From 28 December 06UTC and onwards the ensemble median was above the 99th percentile of the model climate. Note that in the forecast from 31 December 12UTC one ensemble member (number 22) reached almost 50 m/s.
3.4 Monthly forecasts
3.5 Comparison with other centres
4. Experience from general performance/other cases
5. Good and bad aspects of the forecasts for the event
- The forecasts captured the storm 5 days in advance