Status:Finalised Material from: Linus, Mohamed, Fernando, Tim
Discussed in the following Daily reports:
http://intra.ecmwf.int/daily/d/dreport/2015/01/02/sc/
http://intra.ecmwf.int/daily/d/dreport/2015/01/06/sc/
http://intra.ecmwf.int/daily/d/dreport/2015/01/07/sc/
http://intra.ecmwf.int/daily/d/dreport/2015/01/08/sc/
http://intra.ecmwf.int/daily/d/dreport/2015/01/09/sc/
http://intra.ecmwf.int/daily/d/dreport/2015/01/12/sc/
1. Impact
On 9-10 January 3 severe cyclones hit north-western Europe. The first (named Elon -DE, Dagmar - DK) hit Scotland early on Friday 9 January with mean wind of 46 m/s and wind gusts up to 63 m/s in Cairngorm and later hit Denmark and Germany.
he second one (named Nina - NO and Felix -DE) hit the Norwegian west coast on Saturday 10 January with hurricane force on 5 stations and a maximum mean wind of 38 m/s on Eigerøya (gusts of 46 m/s). A third cyclone formed south of Nina in lee southern Norway (named Egon in Sweden) and caused hurricane wind gusts in southern Sweden and heavy snowfall further north. The wind also led to elevated sea-levels along the Norwegian, Danish and Swedish coasts.In Limfjorden, Denmark the sea level reached 195 cm, breaking the old record of 181 cm.
The evaluation below is both for the Friday 9 January and Saturday 10 January.
Facts from: http://artikkel.yr.no/sa-sint-var-nina-1.12143639 and http://www.smhi.se/nyhetsarkiv/egon-sasongens-forsta-ordentliga-storm-1.83408
2. Description of the event
The plots below show observed 24-hour maximum wind gusts for 9, 10 and 11 January. For the 9 January the worst affected areas were Scotland together with Denmark and Germany. On 10 January the strongest winds occurred along the Norwegian west coast. Sweden was also hit by strong wind gusts late on the 10th. On 111 January the strongest gusts were found around the Baltic sea.
Observed maximum 24-hour wind gusts


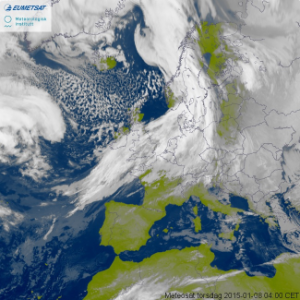
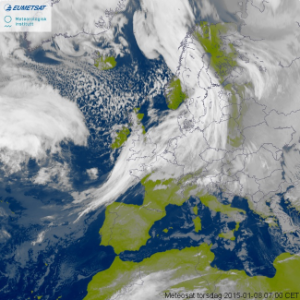
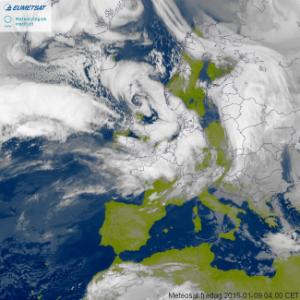
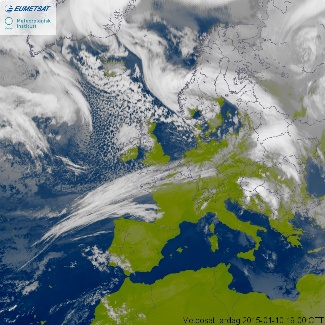
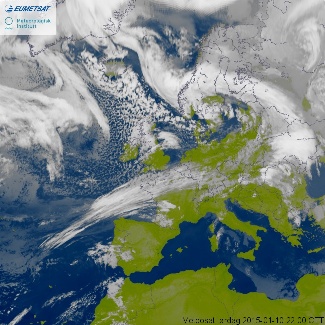
The plots below show satellite images from yr.no every third hour. In the image sequence one can follow the development of the three cyclones.
Satellite images (every 3rd hour) |
|||
|---|---|---|---|

|
|
|

|
|
01. 8 Jan 00z
|
02. 8 Jan 03z
|
03. 8 Jan 06z
|
04. 8 Jan 09z
|

|

|

|

|
|
05. 8 Jan 12z
|
06. 8 Jan 15z
|
07. 8 Jan 18z
|
08. 8 Jan 21z
|

|
|

|

|
|
09. 9 Jan 00z
|
10. 9 Jan 03z
|
10. 9 Jan 06z
|
11. 9 Jan 09z
|

|

|

|

|
|
12. 9 Jan 12z
|
13. 9 Jan 15z
|
14. 9 Jan 18z
|
15 9 Jan 21z
|

|

|

|

|
|
16. 10 Jan 00z
|
17. 10Jan 03z
|
18. 10 Jan 06z
|
19. 10 Jan 09z
|

|

|
|
|
|
20. 10 Jan 12z
|
21. 10 Jan 15z
|
22. 10 Jan 18z
|
23. 10 Jan 21z
|

|

|
||
|
24. 11 Jan 00z
|
35. 11 Jan 03z
|
||
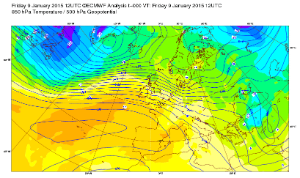
The cyclones formed in connection to a strong baroclinic zone. The plots below shows the analyses of z500 and t850 every 12th hour.
z500 and t850 analysis |
|||
|---|---|---|---|

|

|

|
|
|
1. 8 Jan 00z
|
2. 8 Jan 12z
|
3. 9 Jan 00z
|
4. 9 Jan 12z
|

|

|

|

|
|
5. 10 Jan 00z
|
6. 10 Jan 12z
|
7. 11 Jan 00z
|
8. 11 Jan 12z
|
The plot below show the jet steam and MSLP (in polar projection) for the same analyses as above.
200 hPa wind and MSLP analysis


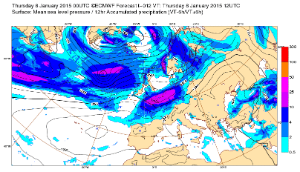
The plots below show 12-hour forecasts of MSLP and precipitation.
MSLP and precip 12-hour fc


Looking back at satellite imagery sequences for both Elon and Felix, and in both there was some evidence, from evaporating fingers of cloud head particulate, of sting jet activity, with model profiles, at least in 2-3 day forecasts, also supportive. For Elon sting jet activity and duration look to have been limited; Felix looked a bit more clearcut. The sequence below is probably after a short sting jet phase for Elon, given that the cloud head tip is already advancing around the cyclone, in 'hammerhead' format. So any strong winds associated were probably due to the 'cold jet' that typically follows.

3. Predictability
3.1 Data assimilation
3.2 HRES
Friday
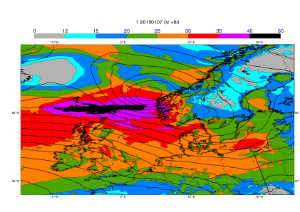
The plots below show the 24-hour maximum wind gusts from HRES valid for 9 January.
14-hour max wind gusts Friday


Saturday
The plots below show the 24-hour maximum wind gusts from HRES valid for 10 January.
14-hour max wind gusts Saturday


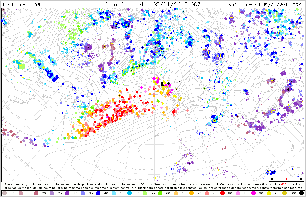
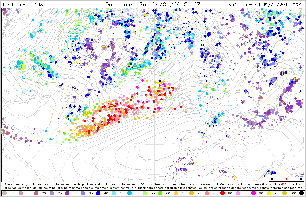
The plots below shows the error in MSLP (shades), forecast (black contours) and analysis (green contours) for the forecast issued 8 Jan 12z. As reference, the NCEP forecast is also included, which for the Saturday storm was almost perfect (not the Friday one). The plots suggests that the ECMWF developed the cyclone somewhat too far north-east.
MSLP error 8 Jan 12z forecast ECMWF


MSLP error 8 Jan 12z forecast NCEP


3.3 ENS
Cyclone feature 1km wind 600 km Friday 00z
The plots below show the cyclone feature plots for maximum wind speed at 1 km height inside a 600 km radius for 9 January 00z.
1 km wind 600 km Friday


Cyclone feature 1km wind 600 km Saturday 12z
The plots below show the cyclone feature plots for maximum wind speed at 1 km height inside a 600 km radius for 10 January 12z.
1 km wind 600 km Saturday


EFI Friday
The plots below show EFI and SOT for wind gusts valid 9 January.
EFI wind gusts Friday


EFI Saturday
The plots below show EFI and SOT for wind gusts valid 10 January.
EFI wind gusts Saturday


CDF for maximum wind gusts
CDF for Bergen, Norway valid 10 January (observed 37.7 m/s in town)

CDF for Lysekil, Sweden valid 10 January (observed 38 m/s, Private)

CDF for Vaxjo, Sweden valid 10 January (observed 29 m/s)

The plot below shows the ensemble forecast for 48-hour maximum wind gusts for 9-10 January inside the box 55-60N, 10-15E (Kategatt). The maximum observed gust was 40 m/s (Vaderoarna, Sweden). The forecast from 4 Jan 00z to 6 Jan 12z were for a median above 35 m/s and 90th percentiel above 40 m/s. The later forecasts got wrongly confident in lower wind gusts.
Return period forecasts
The plots below shows probabilistic forecasts and verification of a binary event defined as exceeding 2-year return period for 24-hour maximum wind gusts.
First plot: 8 January 06z - 9 January 06z. Second plot: 9 January 06z - 10 January 06z. Third plot: 10 January 06z - 11 January 06z.


Regime forecasts
The plot below shows a 2-d plot of projections into regime 1 (NAO+) and regime 2 (Scandinavian blocking), where each plot represents an analysis at 00z and the last point (lower right) the the 11 January. On 9-10 January the projection was very strong on positive NAO.

The plot below shows the ensemble forecast of projection to regime 1 where the x-axis represents the initial time of the forecast. Forecast from 1 January and onwards had a strong positive NAO signal, especially from the 4 January and onwards.

3.4 Monthly forecasts
3.5 Comparison with other centres
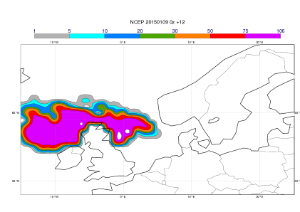
The plot below shows forecasts from different centres for probability for >25 m/s 10-metre mean wind from 6-hourly data, valid 10 January. The data are from the TIGGE archive.
Prob ws>25 m/s ECMWF Friday


Prob ws>25 m/s NCEP Friday


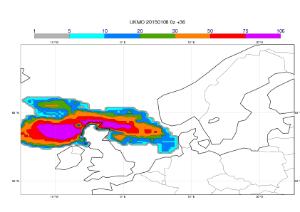
Prob ws>25 m/s UKMO Friday


Prob ws>25 m/s DMI-HIRLAM Friday


Prob ws>25 m/s GLAMEPS Friday


The plots below are the same as above but for 10 January.
Prob ws>25 m/s ECMWF Saturday


Prob ws>25 m/s NCEP Saturday


Prob ws>25 m/s UKMO Saturday


Prob ws>25 m/s DMI Saturday


Prob ws>25 m/s GLAMEPS Saturday


4. Experience from general performance/other cases
5. Good and bad aspects of the forecasts for the event
- Early signal for transition to strong positive NAO
- Good predictability for the Friday storm over Scotland
- More problems for Saturday storms
6. Additional material
- Presentation from Fernando FD/RD March 2015 about the 10-metre wind difference in HRES and CF during Elon.
Obs/Fc scatter plot
The figure below shows the scatter plot of observations and short forecasts of 24-hour maximum wind gusts for 9 January (blue), 10 January (red) and 11 January (green). Tim found that there is a maximum in the SYNOP code (99 knot) for wind gusts, which seems to have been hit by 6 stations during this event.
