Status: Finalised Material from: Mohamed, Linus
1. Impact
In March 2017 floods and land slides hit West Peru (mainly in Lima) due to heavy rainfall. More than 70 people have died and thousands lost their homes. The enhanced rainfall activity is likely to be connected with abnormal high temperature anomalies in Northern West coast of Peru (around 4.5 C). The rain is mainly affecting coastal areas dominated by relatively high orography. Northern Peru was hit by severe flooding.
2. Description of the event
3. Predictability
3.1 Data assimilation
3.2 HRES
The plots below show the daily average precipitation between 1 and 31 March from observations (left), 12-24 hour forecasts (middle) and 120-144 hour forecasts (right).


3.3 ENS
3.4 Monthly and seasonal forecasts
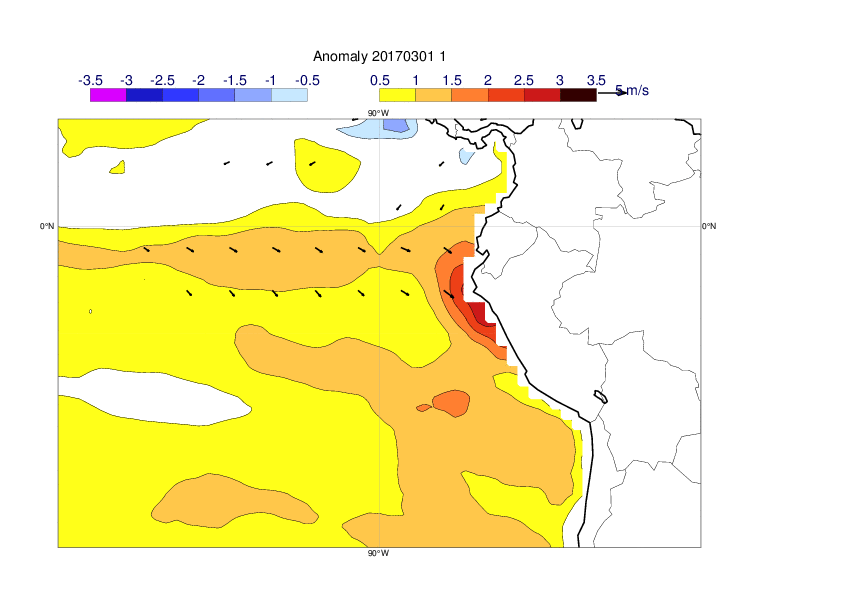
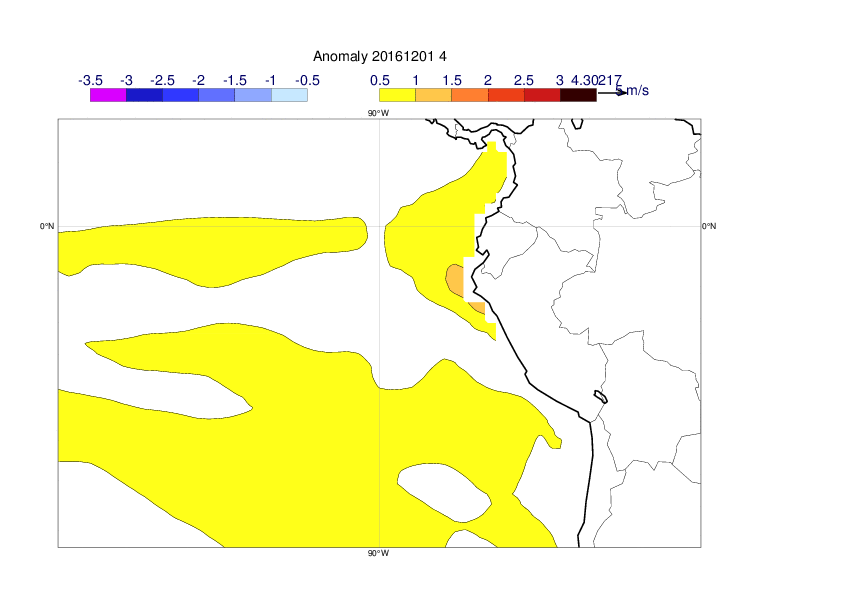
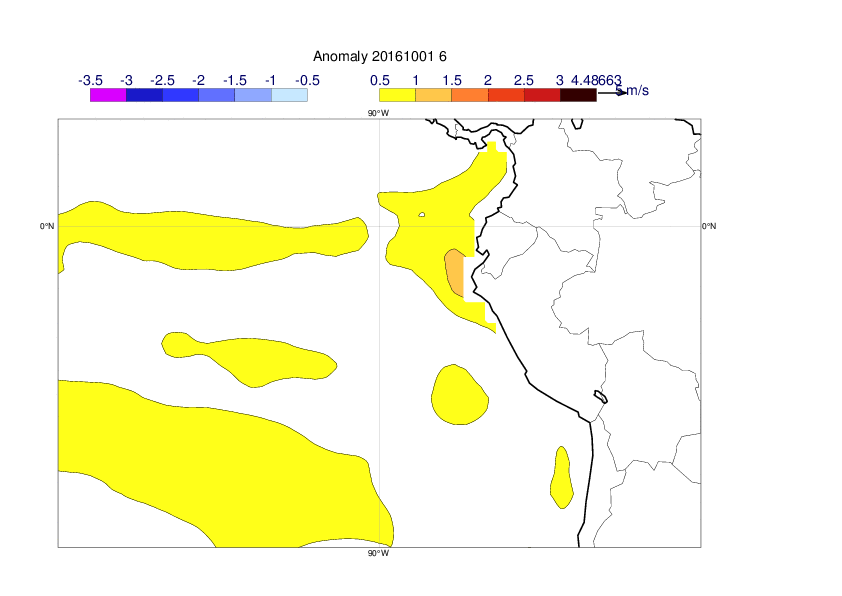
The plots below show the ensemble mean precipitation anomaly for March 2017 from seasonal (system 4) forecasts. The signal was well captured in the forecast from 1 February but on January. However, earlier forecasts had a signal of wetter than normal.


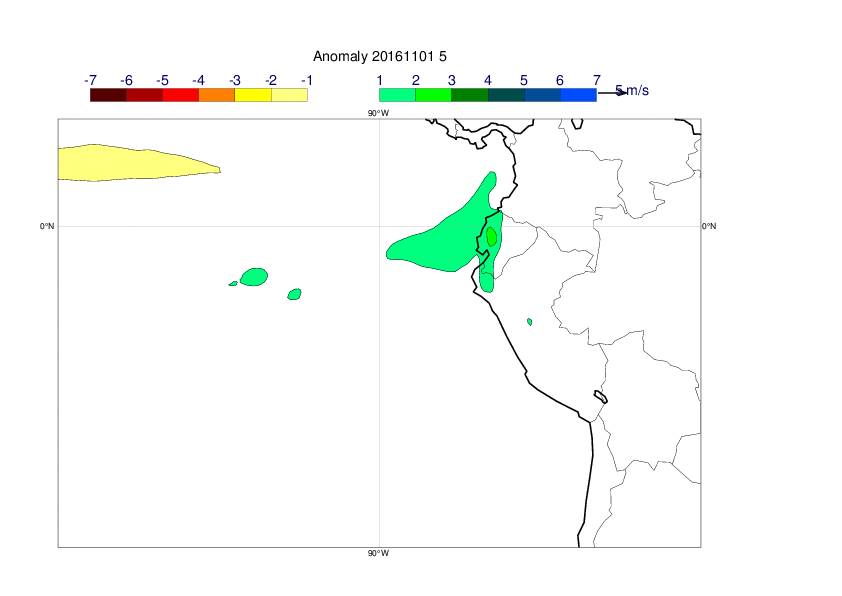
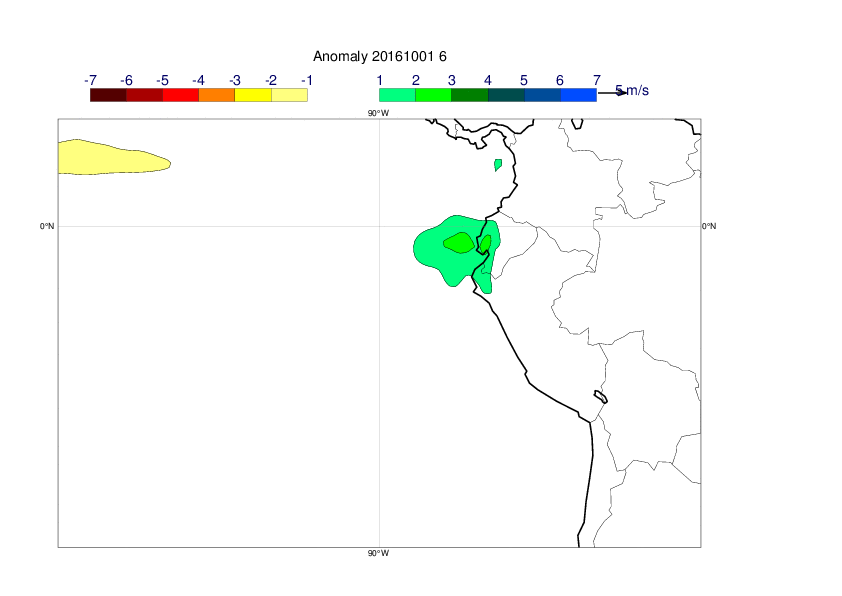

The plots below show the same as above but for SST anomalies. The precipitation anomalies are linked to warm SST along the coast, with also was well captured in February but missed in January. The forecasts from December, November and October had the coastal anomaly as well.


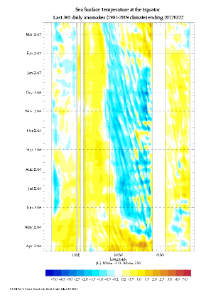
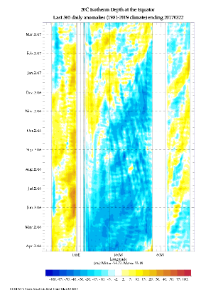
The plots below show Howmuller diagram of SST (left) and depth of 20C isoterm (right) along the equator from the ocean analysis. There are signs of a Kelvin wave propagating from west to east, starting in October and reached the South-American coast in February.
3.5 Comparison with other centres
The plots below compares 3-month (Feb-Apr) precipitation anomalies from 1 January for ECMWF (left) and EUROSIP (right). As seen above, ECMWF missed the anomaly for this initial date while the EUROSIP gave a consistent signal.


3.6 EFAS
Glofas flood forecast are clearly flagging the areas affected by the floods even tough the catchments are relatively small .

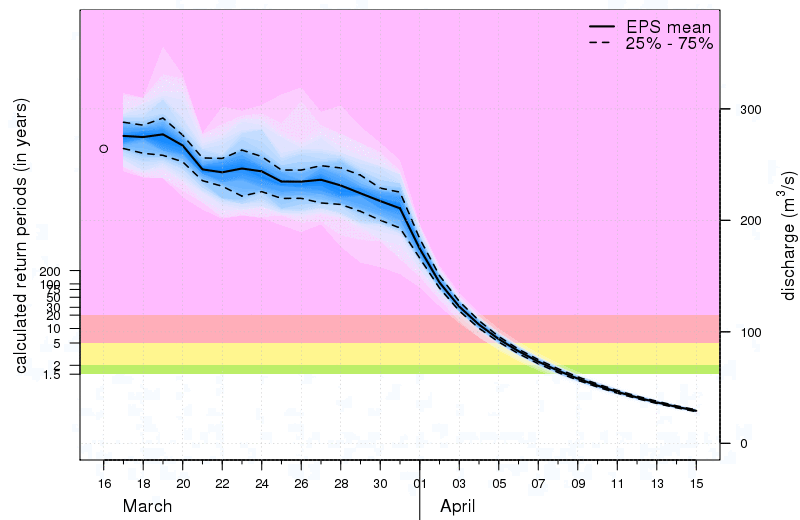
(Left) Reporting points exceeding 20 years return period. product based on 22/03/2017
(Right) Hydrograph for Lima
4. Experience from general performance/other cases
5. Good and bad aspects of the forecasts for the event
- The seasonal forecast missed the warming in January forecast