Status: Finalised Material from: Linus, Jonny
1. Impact
On 10-11 January a deep cyclone caused extreme winds over eastern Greenland, Svalbard and northern Scandinavia. On Svalbard ~100 people were evacuated ahead of the storm.
2. Description of the event
The plots below show analyses of MSLP and 6-hour precipitation forecasts.

The plots below show analyses of z500 and t850.

3. Predictability
3.1 Data assimilation
3.2 HRES
Time-series of wind gust for Tasiilaq on eastern Greenland from observations (black) and short forecasts (blue and red).
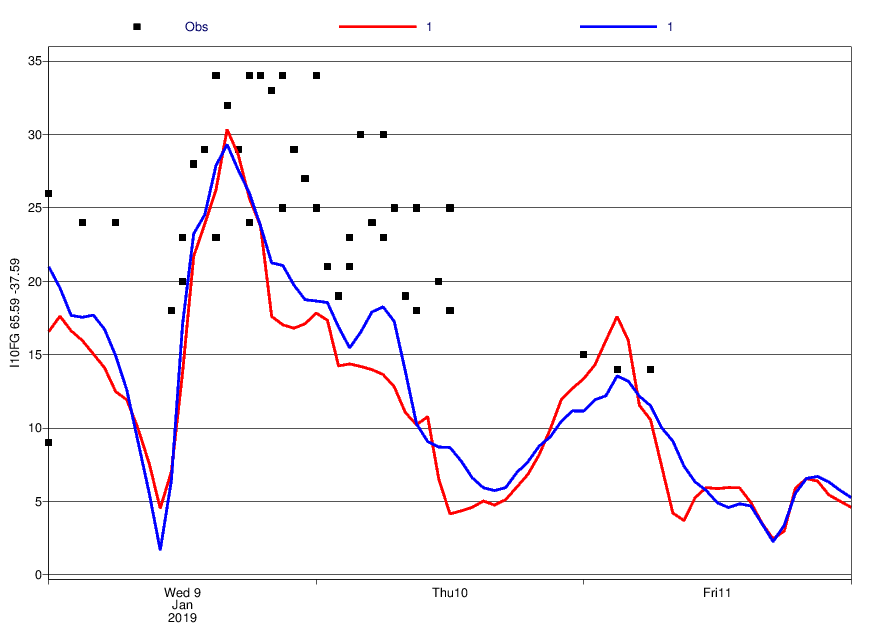
A maximum wind gust of 35m/s was felt in Tasiilaq late on 9 January (red dot in the top-left corner of the first map below). The difference between adjacent stations in the map on the left and the strong gradients in the forecast show a large spatial heterogeneity in the winds. Dispute this, for Tasillaq at least, the HIRES and CTRL forecast do quite a good job of forecasting both the timing and the intensity of the period of wind-gusts there.
The plots below show observations of 24-hour maximum wind gusts valid 10 January 12UTC to 11 January 12UTC (first plot) and HRES forecasts valid at the same period. The forecast plots also includes MSLP valid 11 January 00UTC.


3.3 ENS
The plots below show EFI and SOT for 24-hour maximum wind gusts valid on 10 January (we are only producing EFI for 00UTC-00UTC).
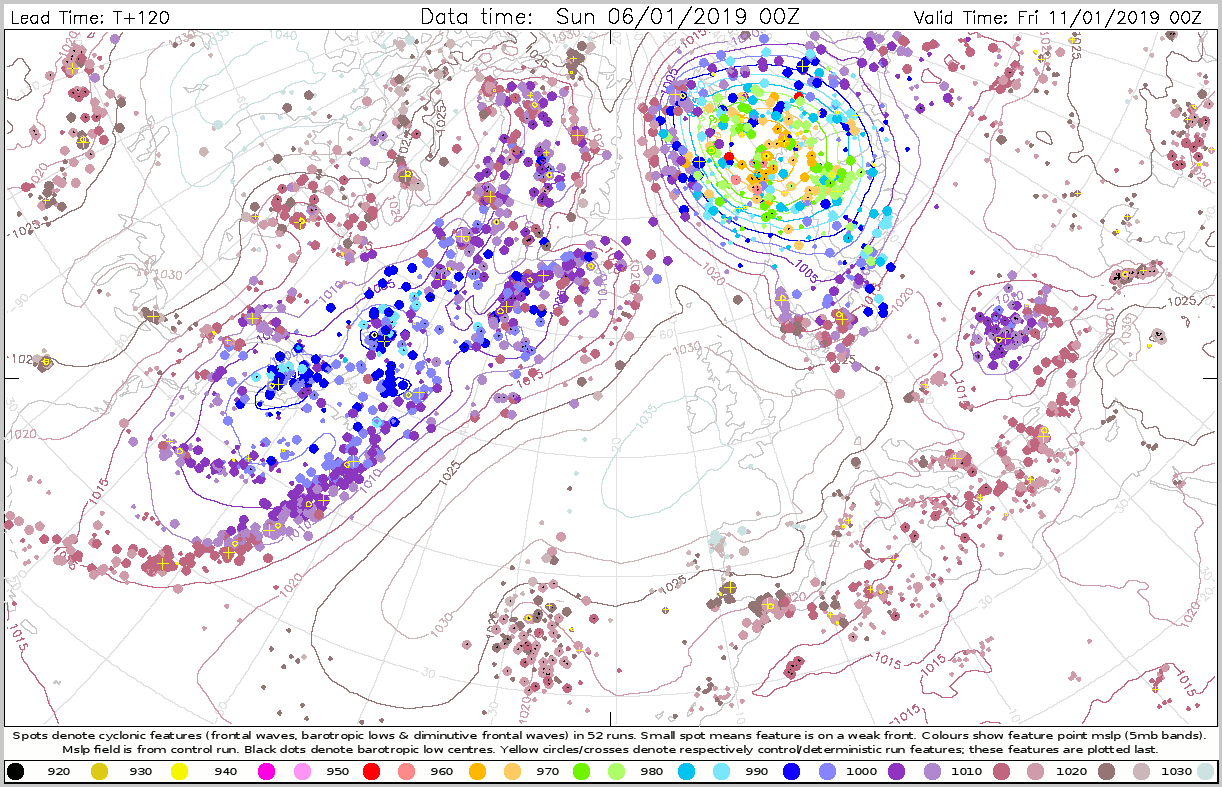
The plots below show cyclone feature plots valid 11 January 00UTC and where the colour represents the MSLP in the centre of the cyclone.


3.4 Monthly forecasts
3.5 Comparison with other centres
4. Experience from general performance/other cases
5. Good and bad aspects of the forecasts for the event
- The storm was well captured 6 days in advance