Status: Finalised Material from: Linus
1. Impact
On 25 February torrential rainfall hit Crete, with many roads flushed away and leaving one dead.
http://floodlist.com/europe/greece-crete-storm-oceanis-february-2019
2. Description of the event
The plots below show analyses of MSLP and 6-hour precipitation forecasts every 12h hour between 23 and 26 February.


The plots below show analyses of z500 and t850 every 24 hour between 22 and 27 February.


3. Predictability
3.1 Data assimilation
3.2 HRES
The plots below show observations and forecasts of 24-hour precipitation valid from 25 February 00UTC to 26 February 00UTC.


3.3 ENS
The plots below show EFI and SOT for total precipitation valid 25 February.


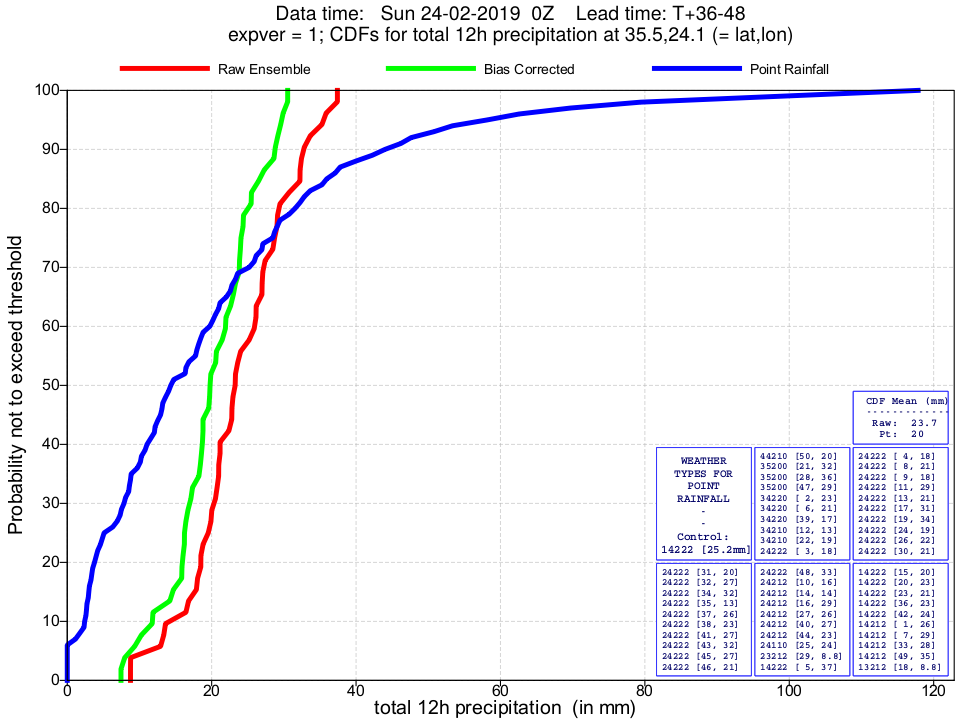
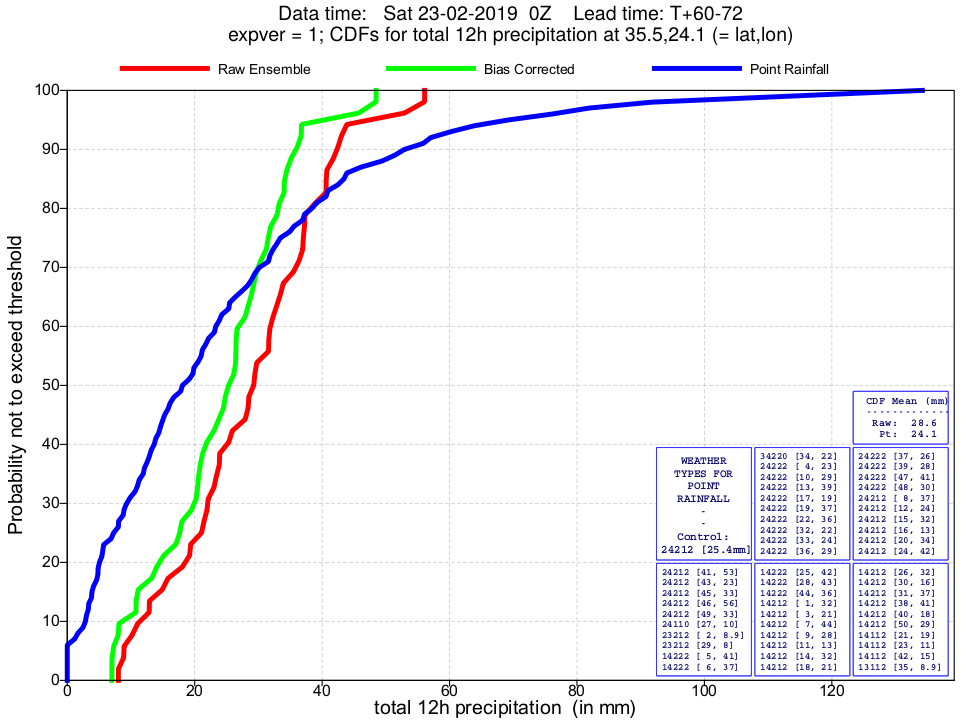
The plots below show the CDF for 12-hourly precipitation for Souda that recorded 116mm over the period. The plots include the raw ensemble (red), bias corrected raw ensemble (green) and EcPoint distribution to account to sub-grid variability (blue).


The plot below shows the evolution of forecast for the 24-hour precipitation valid 20 August for Sempronas (35.4N,23.8E). The plot includes ensemble (blue box-and-whisker), HRES (red dot) and model climate (red box-and-whisker).