Status: Finalised Material from: Linus
1. Impact
On 23 November the southern part of Piedmont together with south-eastern France was hit by torrential rainfall.
https://www.theguardian.com/world/2019/nov/25/storms-france-greece-italy-destruction-floods
2. Description of the event
Accumulated precipitation from observations in the box 44.3N-45.5N, 7.5E-9.5E from 1 September (black, think) and daily accumulations (black, thin). Values from the observation climatology in grey. The 23 November stands out as extreme, but the region also saw extreme rainfall during the 2nd half of October, see 201910 - Rainfall - Italy .

The plots below show analyses of z500 and t850 from 20 to 24 November.


3. Predictability
3.1 Data assimilation
3.2 HRES
The plots below show observations (first plot) and HRES forecasts valid the 23 November but from different initial times. The average of the observations in the box was 113 mm (based on 289 obs). The mean of the latest forecast for the same locations was 86 mm, and the box average 66 mm.


3.3 ENS
The plots below show EFI and SOT for 1-day precipitation valid for 23 November.


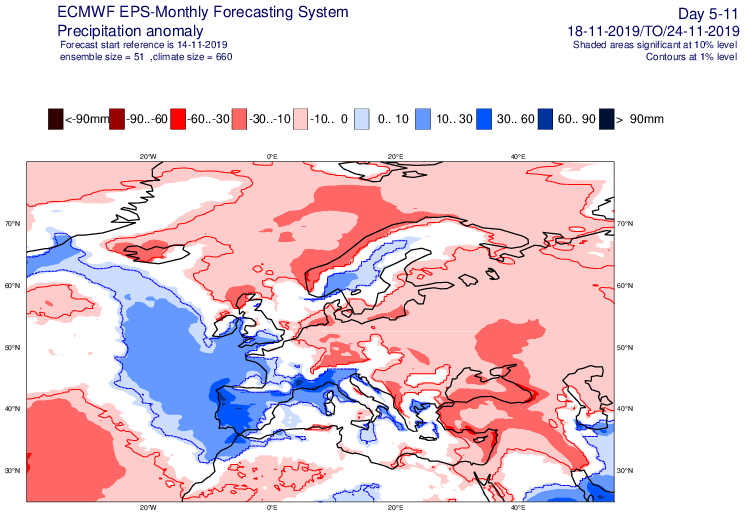
3.4 Monthly forecasts
The plots below show weekly anomalies for precipitation valid 18-24 November.


3.5 Comparison with other centres
4. Experience from general performance/other cases
- The similar region was affected a month earlier, but that time more convective: 201910 - Rainfall - Italy