Status: Finalised Material from: Linus
1. Impact
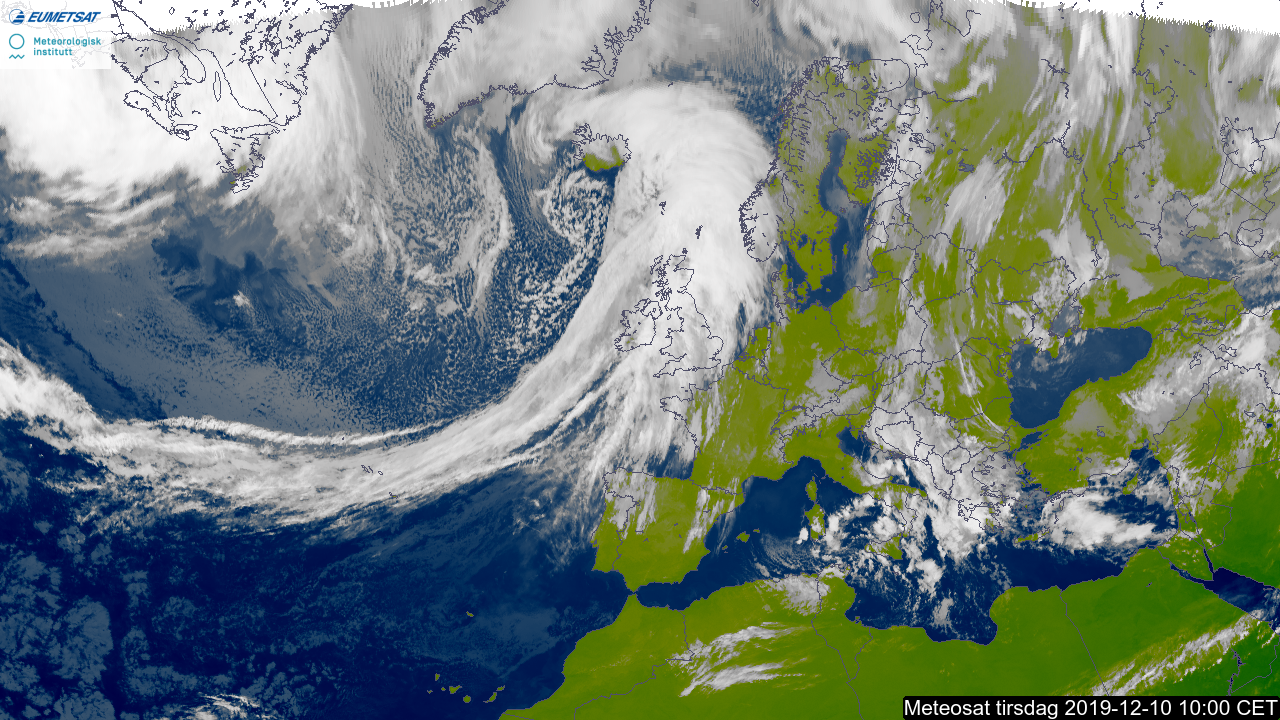
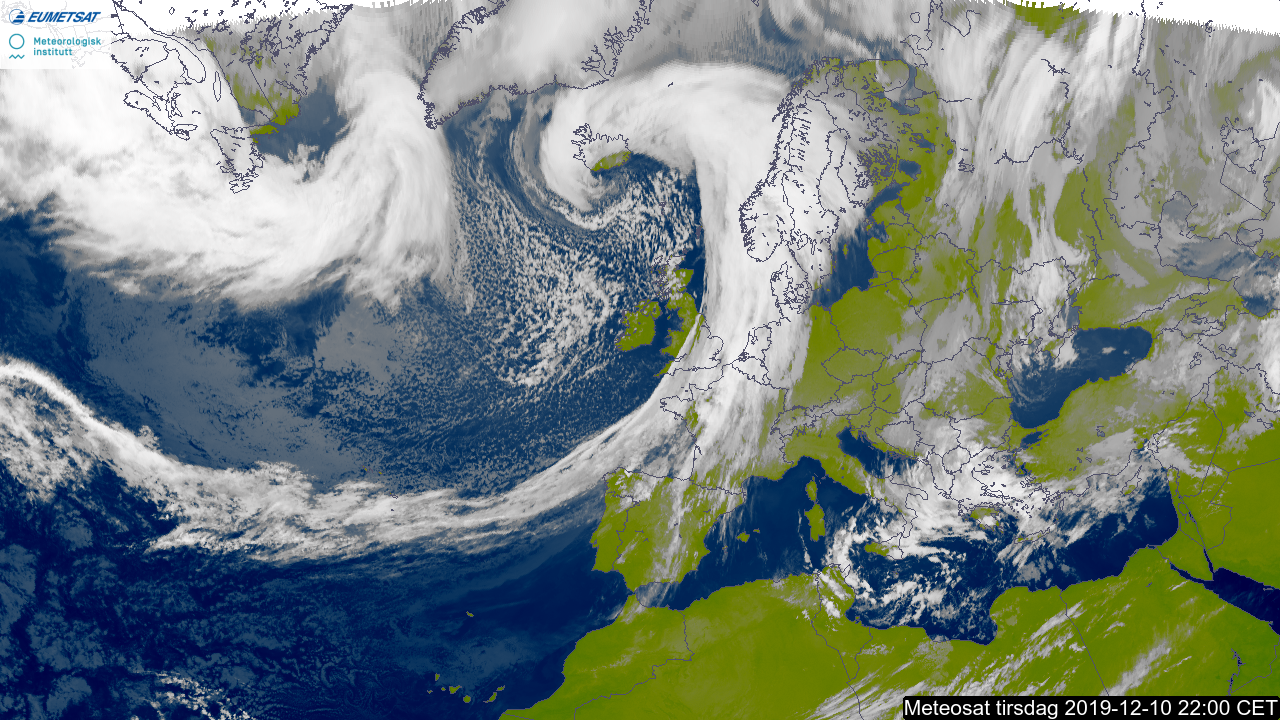
On 10-11 December an intense cyclone hit Iceland bringing extreme winds and snowfall to the north-western part of the island. Red warnings were put out for the storm by the Icelandic met service.

2. Description of the event
The plots below show satellite images from 10 December 06UTC to 11 December 06UTC. (from yr.no)


The plots below show MSLP and 6-hour precipitation from short forecasts covering 9-11 December.


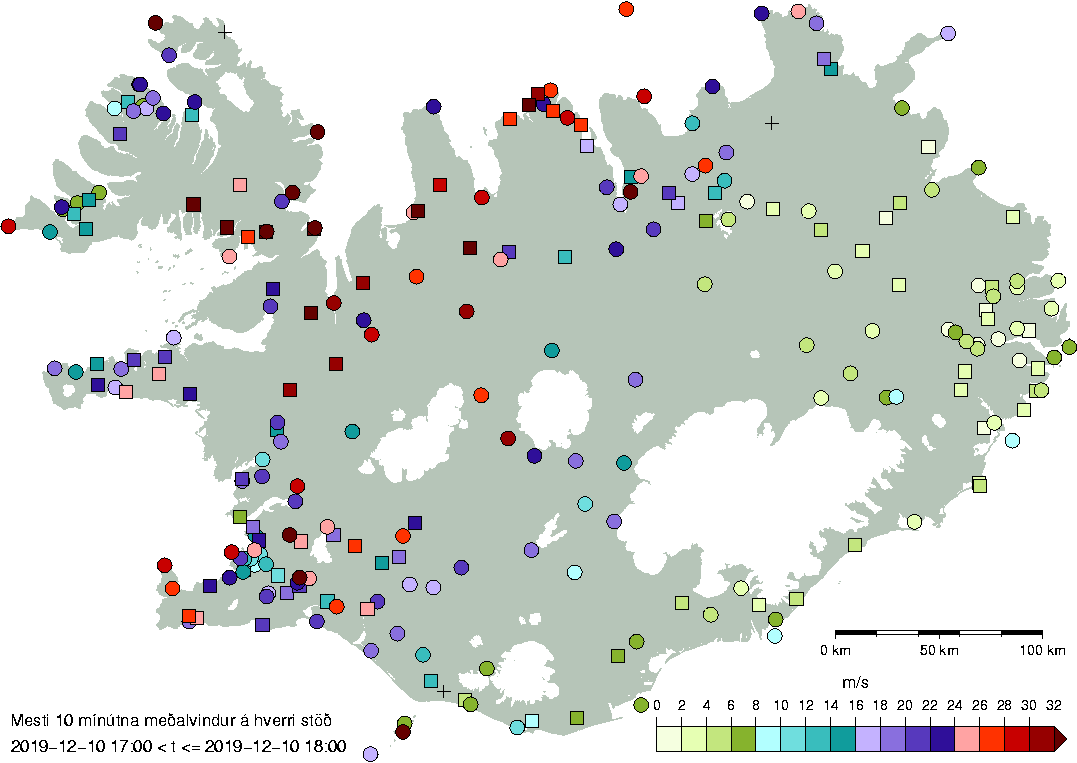
The plot below shows maximum 10-minute mean wind between 17 and 18UTC on 10 December. (provided by IMO, more times available here: http://brunnur.vedur.is/pub/teitur/klstvindur/html/2019/12/vindur_klst_2019-12-10_17.html)
3. Predictability
3.1 Data assimilation
3.2 HRES
The plots below show HRES forecasts for 24-hour maximum wind gusts valid 10 December 12UTC to 11 December 12UTC and MSLP valid 11 December 00UTC from different initial times.


3.3 ENS
The plots below show EFI and SOT for 24-hour maximum wind gusts on 10 December.


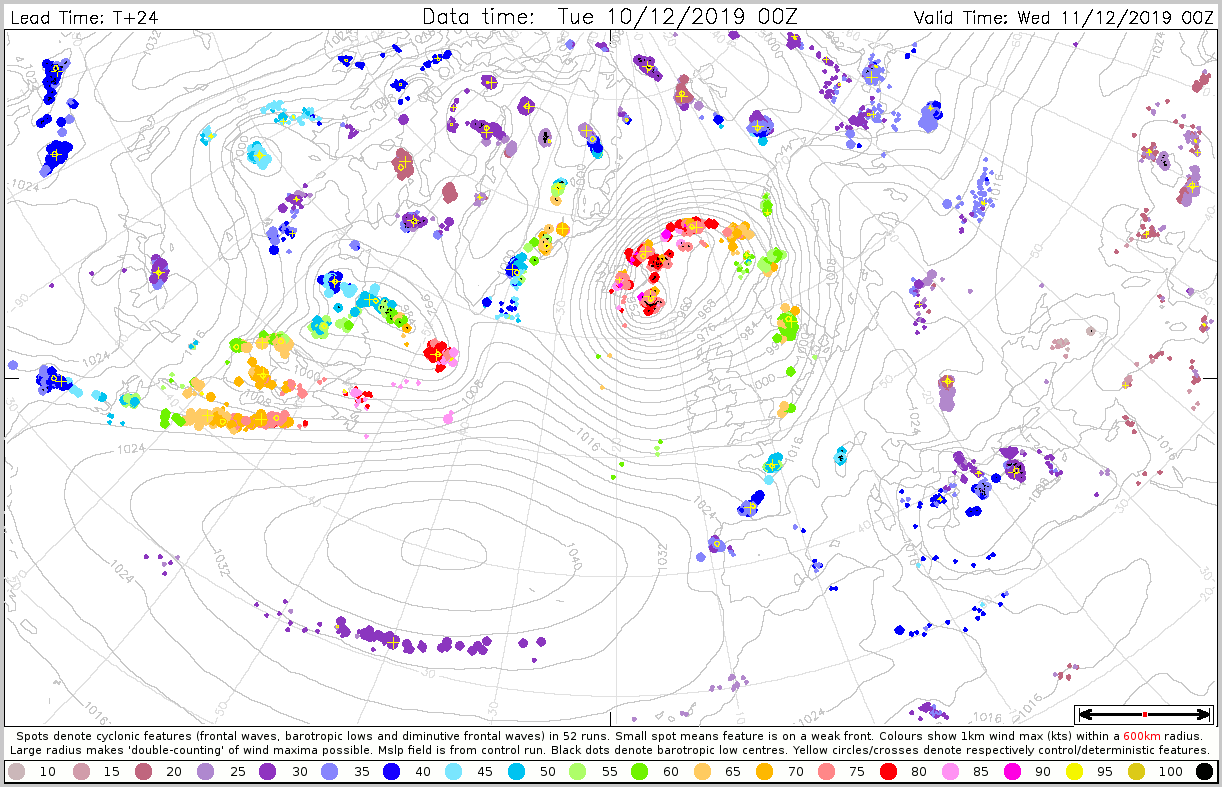
The plots below show the cyclone feature plots for the same forecasts as above, with the colouring of the dot marking the maximum wind speed within 600 km.


The plot below shows the evolution of forecast for 24-hour maximum wind gusts valid 10 December 12UTC to 11 December 12UTC for a point on the Icelandic north coast (lat=65.58, lon=-20.22)). The plot includes ensemble (blue box-and-whisker), HRES (red dot) and model climate (red box-and-whisker). The signal for the extreme gradually appeared starting from 6 December, but reached the really extreme (ensemble median outside 99th percentile of model climate) on 9 December.

3.4 Monthly forecasts
The plots below show the weekly MSLP anomaly valid 9-15 December. Already the forecast from 21 November had a hint of a positive NAO for this period.


