-
Created by
 Linus Magnusson, last updated on Jan 05, 2021
4 minute read
Linus Magnusson, last updated on Jan 05, 2021
4 minute read
Status: Finalised Material from: Esti, Linus
1. Impact
Parts of Europe have recorded less than 10% of their rain so far in April , some places have seen no rain at all (i.e. Germany). Meanwhile, Catalonia has recorded ~500% of their monthly rain. All stations in Barcelona have already exceeded 400mm since January 1st (almost 500mm in the upper areas of the city) and the average annual rainfall is around 600mm.
The last heavy rain episode happened between 19 and 21 April. A cut of low crossed the Iberian Peninsula from west to east towards the Mediterranean and it left an episode of rain and storms especially significant last Tuesday, 21st April. Rainfall affected a large part of the peninsular territory (as we can see in the 24h total precipitation observations map), but it was in the northeast where they showed the greatest intensity. A precipitation band associated with the cyclone, already occluded over the western Mediterranean, was persistently affecting the northeast of the peninsula. It is a practically stationary front with embedded convection that was giving rise to some scattered storm (we can see like a small meso-low in the surface wind field in the Mediterranean sea in front of Barcelona coast which was feeding the cyclone with more humidity).
2. Description of the event
OBSERVATIONS:

3. Predictability
3.1 Data assimilation
3.2 HRES

3.3 ENS
CDFs for ENS and ecPoint-12 rainfall for different runs and EFI 24h precipitation for different runs and comparison between 46r1 ans 47r1:


3.4 Monthly forecasts
The plot below show weekly precipitation for 20-26 April in the verification and extended-range forecasts initialised at different times.

3.5 Comparison with other centres
4. Experience from general performance/other cases
EFI for 24-h precipitations performed quite well for this event, pointing not only the intensity if not also the most affected area. Maybe the maximum values of EFI (between 0.8 and 1) were extended farther west and we cannot see so large values of precipitation in the observation map, however that corresponds to a really dry desert area which does not register too much precipitation during the year and it is mainly due to some convective storms. Another good point is that the area was quite well highlighted even 6 days in advance, which is not so easy if we are speaking about cut-off lows in the Mediterranean. I also compared EFI values from e-suite and o-suite and they are pretty similar, although we could say that on days 4 and 5 e-suite performed slightly better in terms of extension and intensity of the EFI signal.
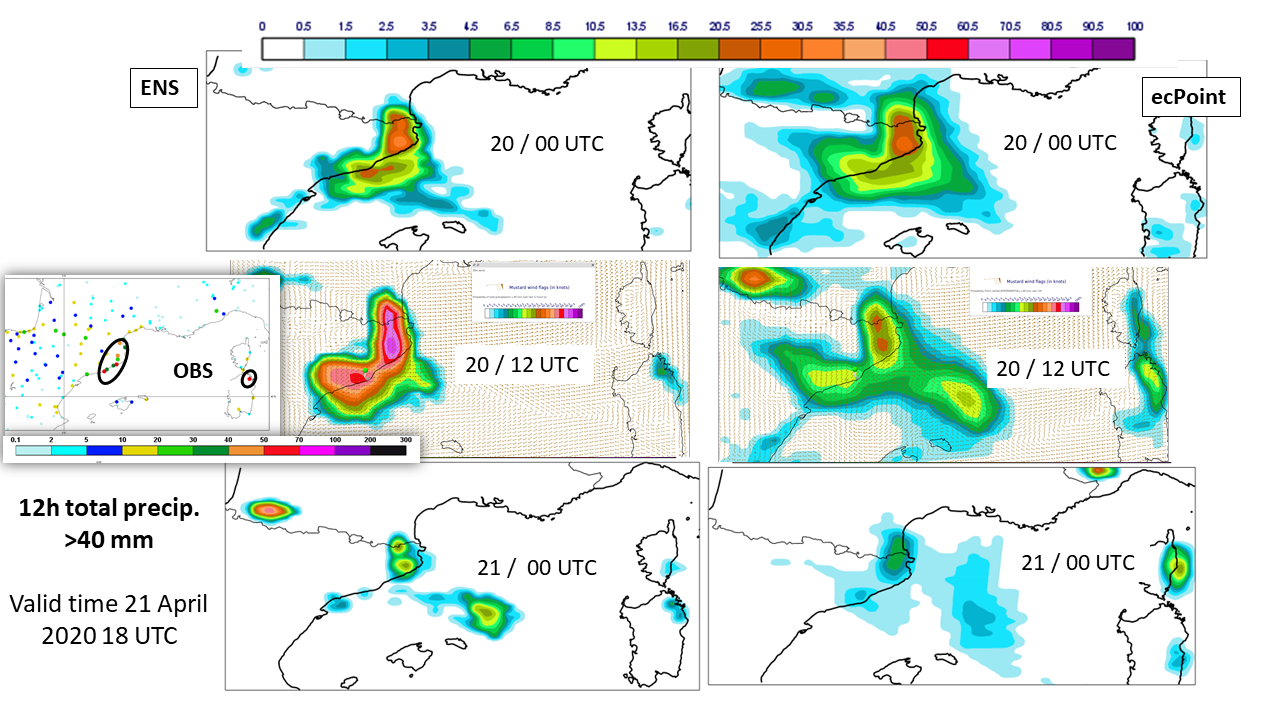
An interesting point from this case is that last forecast run before the rain episode, the ENS and HRES performed much worse than the 2 previous ones. It seems that in that last run, the amount of precipitation was considerably underestimated. I plotted the probabilities of 12h total precipitation > 40 mm for the last previous runs before to the event, and we can clearly see in the raw ENS forecast a 'jumping' in the probabilities of occurrence of the episode.