-
Created by
 Linus Magnusson, last updated on Feb 10, 2021
7 minute read
Linus Magnusson, last updated on Feb 10, 2021
7 minute read
Status: Ongoing analysis Material from: Linus
1. Impact
On 11-12 January central-northern parts of Sweden and southern Finland was hit by extreme snowfall together with strong winds. Some stations in central Sweden reported more than 50 cm of snow accumulation. A rare red warning was issued for the event by SMHI.
Material from SMHI (in Swedish):
https://www.smhi.se/bloggar/vaderleken-2-3336/over-en-halvmeter-nysno-i-angermanland-1.167725
2. Description of the event
Warnings on Meteoalarm on 11 January valid for 12 January.

Snow analysis from SMHI for 11 January (before the event) and 13 January (after the event).


The plots below show analyses of MSLP and 6-hour forecasts of precipitation. The first plot is from 10 January 12UTC and last 13 January 00UTC, every 12 hours.


The plots below show analyses of z500 and t850 from 9 to 12 January (12UTC), every 24h.


3. Predictability
3.1 Data assimilation
3.2 HRES
The plots below show HRES forecasts of 24-hour maximum wind gusts ending on 12 January 12UTC.


The plots below show HRES forecasts of 24-hour precipitation ending on 12 January 12UTC.


3.3 ENS
The plots below show EFI and SOT for 24-hour maximum wind gusts on 11 January (00-00UTC).


The plots below show EFI and SOT for 24-hour precipitation on 11 January (00-00UTC).


The plots below show EFI and SOT for 24-hour precipitation on 12 January (00-00UTC).


The plot below shows the forecast evolution for 24-hour precipitation ending on 12 January 12UTC averaged inside the box outlined in the plots above. The plot includes HRES (red dot), ENS control (purple dot), ENS distribution (blue boxes, median square and mean diamond) and model climate distribution (red boxes).

The below below shows the forecast evolution for 24-hour maximum wind gusts for the same region.

------------
To directly compare the predictions of the event 202101 - Rainfall / Snowfall - NW Europe in almost the same region, the plot below show EFI and SOT for 3-day precipitation 11-13 January, and the evolution plot is for the same period in the outlined box. The signal was captured later in this event compared to the event a week later.


-----------
To evaluate the forecasts for the cold spell that followed after the cyclone, the plot below evaluates the forecasts for 2-metre temperature over southern Sweden 14-16 January, for the region outline in the 1-3 day EFI plot for the same period below. The cold signal started to appear on 28 December.

The plot below shows the joint probability of >10mm snowfall water eq. and >20 m/s wind gusts on the first 6 hours of 12 January in the forecast from 10 January.

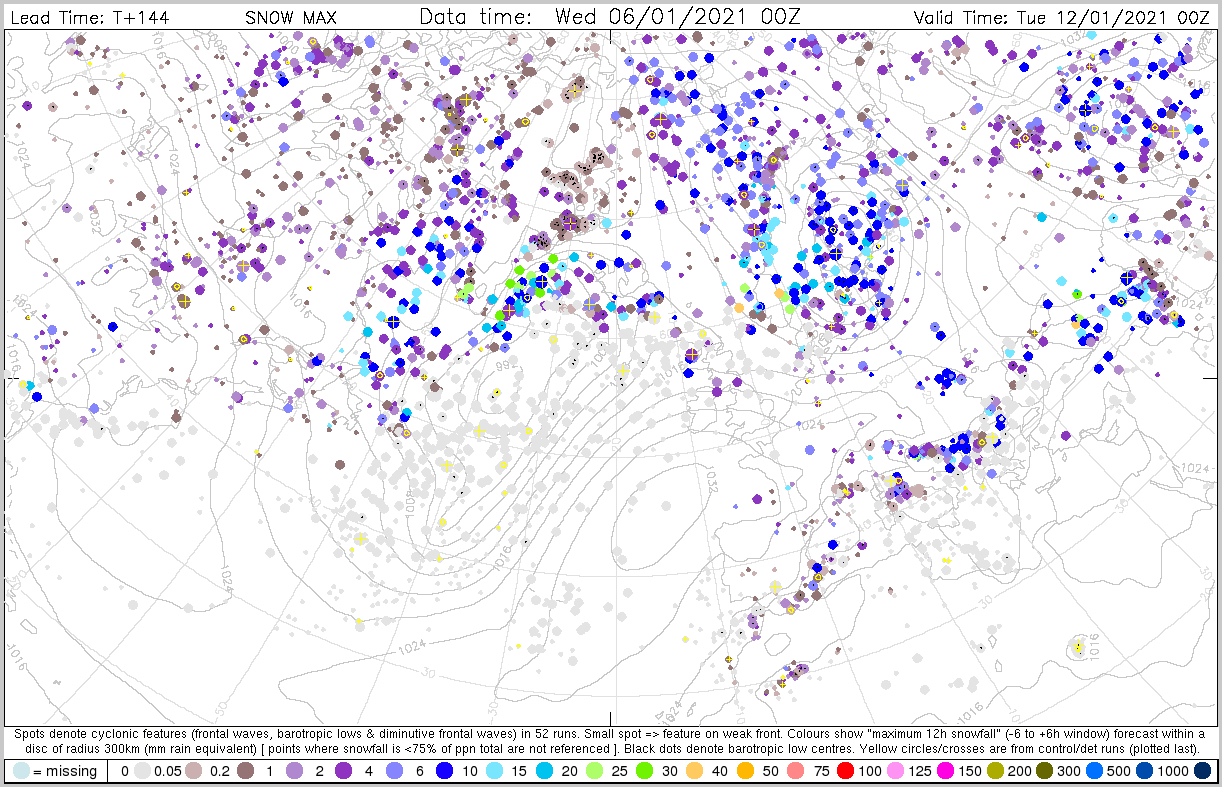
The plots below show the cyclone feature product for snow maximum within 300 km, valid on 12 January 00UTC