-
Created by
 Linus Magnusson, last updated on Aug 16, 2023
4 minute read
Linus Magnusson, last updated on Aug 16, 2023
4 minute read
Status:Ongoing analysis Material from: Linus
1. Impact
In the third week of July 2023, southern Europe and Northern Africa was hit by a heatwave. On 18 July Rome broke the temperature record reaching 41.8C (https://www.theguardian.com/world/2023/jul/18/italian-hospitals-report-rise-in-heat-cases-as-rome-hits-41-point-8c#:~:text=Temperatures%20in%20Rome%20hit%2041.8,C%20set%20in%20June%202022) with temperatures reaching above 47C on Sardinia. During a 2nd wave the week after even higher temperature was reached on the island.
During the heatwave, Greece was hit by severe wildfires, especially on the island Rhodes.
For a summary of about the temperature, see:
https://climate.copernicus.eu/surface-air-temperature-july-2023
2. Description of the event
The plots below show analyses of z500 and T850 from 15 July to 27 July 00UTC, every 24 hour.


The plot below shows a time-series of daily 2-metre temperature (based on 00 and 12UTC ERA5 analyses) for central Italy (red) and southern Sweden (blue), starting from 1 May. Thin lines represent daily mean, thick lines 7-day running mean and dashed lines ERA5 daily climatology. One can see the strong heatwave over Italy during July with two peaks on 18-19 July and 2 July. The temperatures sharply dropped after 24 July peak. While southern Europe saw the heatwave, Northern Europe was dominated by milder conditions during July, after a heatwave in June.

3. Predictability
3.1 Data assimilation
3.2 HRES
3.3 ENS
The plots below show EFI and SOT for maximum 2-metre temperature on 18 July. Rome is marked with an hourglass.


The plot below shows the forecast evolution plot for maximum 2-metre temperature on 18 July for Rome. Mean of observations - green hourglass, concatenated 6-hour forecasts - green dot, HRES –red dot, ENS blue box-and-whisker, ENS-EXT purple box-and whisker, ENS Model climate – cyan box-and-whisker and ENS-EXT Model climate – pink box-and-whisker. Ensemble mean as black diamonds. Triangle marks the maximum/minimum in the model climate based on 1200 forecasts.

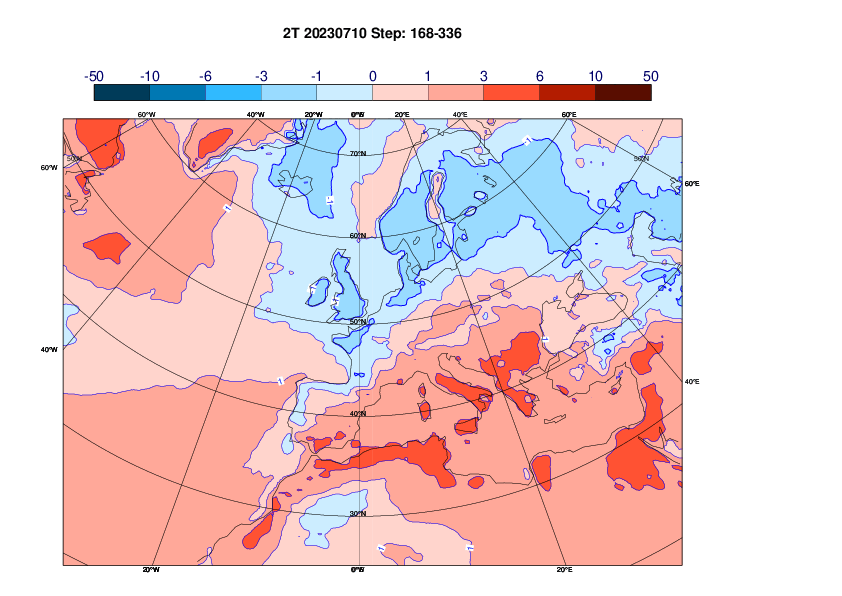
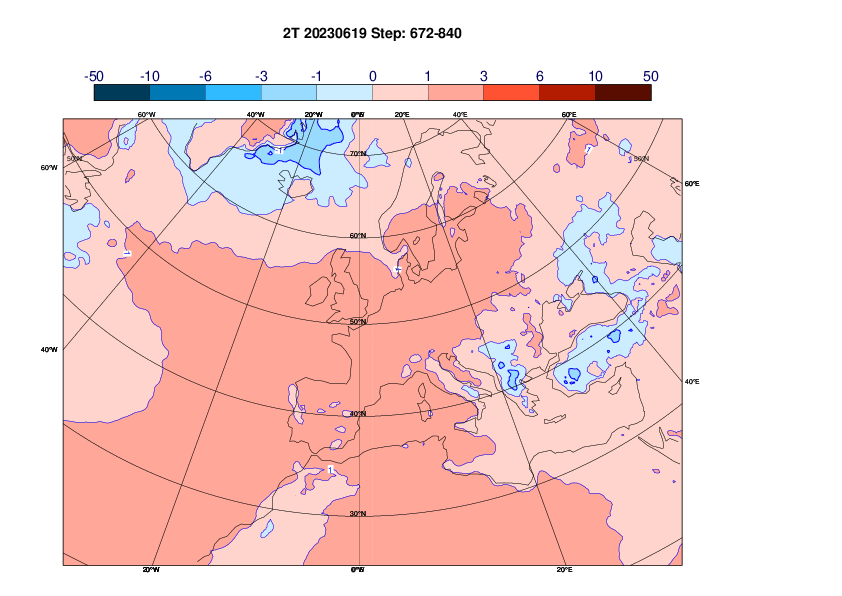
3.4 Monthly forecasts
The plots below show 2-metre temperature anomalies for 17-24 July from different initial times with 7 days apart. While a warm western-central Mediterranean was captured at all lead times, the forecasts from 3 July and before missed the cold anomaly over northern Europe.