-
Created by
 Linus Magnusson, last updated on Aug 14, 2023
7 minute read
Linus Magnusson, last updated on Aug 14, 2023
7 minute read
Status:Ongoing analysis Material from: Linus, David L.
1. Impact
In the second week of August storm Hans battered Scandinavia with severe rainfall in southern Norway and parts of Sweden. On the Swedish side a train de-railed south of Hudiksvall along the east-coast, the ski-resort Are was hit by a flashflood, and coastal flooding on the west coast due to combination of rainfall and winds. On the Norwegian side the rainfall was the heaviest on 100 years in the eastern part, causing widespread floodings.
https://www.met.no/nyhetsarkiv/over-100-ar-siden-det-har-regnet-sa-mye-pa-ostlandet
2. Description of the event
The plots below show analyses of MSLP and 6 hour rainfall from 4 August 00UTC to 10 August 00UTC, every 12th hour. The cyclone Hans formed on 6 August over eastern Europe and moved to north-west, with extremely warm and moist air to the north-east. The cyclone later became stationary over southern Scandinavia giving persisting rainfall over south-eastern Norway and large parts of Sweden.


The plots below show analyses of z500 and T850 from 4 August to 10 August 00UTC, every 24 hour.


3. Predictability
3.1 Data assimilation
3.2 HRES
The plots below show 72-hour precipitation (7 August 00UTC - 11 August 00UTC) in observations (first plot) concatenated short forecasts (second plot) and o-suite HRES forecasts with different lead times.


The plots below show a sequence from 6 August to 10 August, every 12th hour of MSLP and 10-metre wind in analyses, HRES forecasts and PanguWeather machine-learning model both from 5 August 00UTC.
Analyses:


HRES:


PanguWeather:


3.3 ENS
The plots below shows EFI and SOT for 3-day precipitation (7 August 00UTC - 11 August 00UTC) from different initial dates.


The plot below shows the forecast evolution plot for 72-hour precipitation (7 August 00UTC - 11 August 00UTC) for 2 degree box over southern Norway (see plots above). Mean of observations - green hourglass, concatenated 6-hour forecasts - green dot, HRES –red, ENS blue box-and-whisker, Model climate – cyan box-and-whisker. Ensemble mean as black diamonds. Triangle marks the maximum in the model climate based on 1800 forecasts.

3.4 Monthly forecasts
The plots below show the 7-day precipitation anomaly for 7-13 August from different initial dates.


3.5 Comparison with other centres
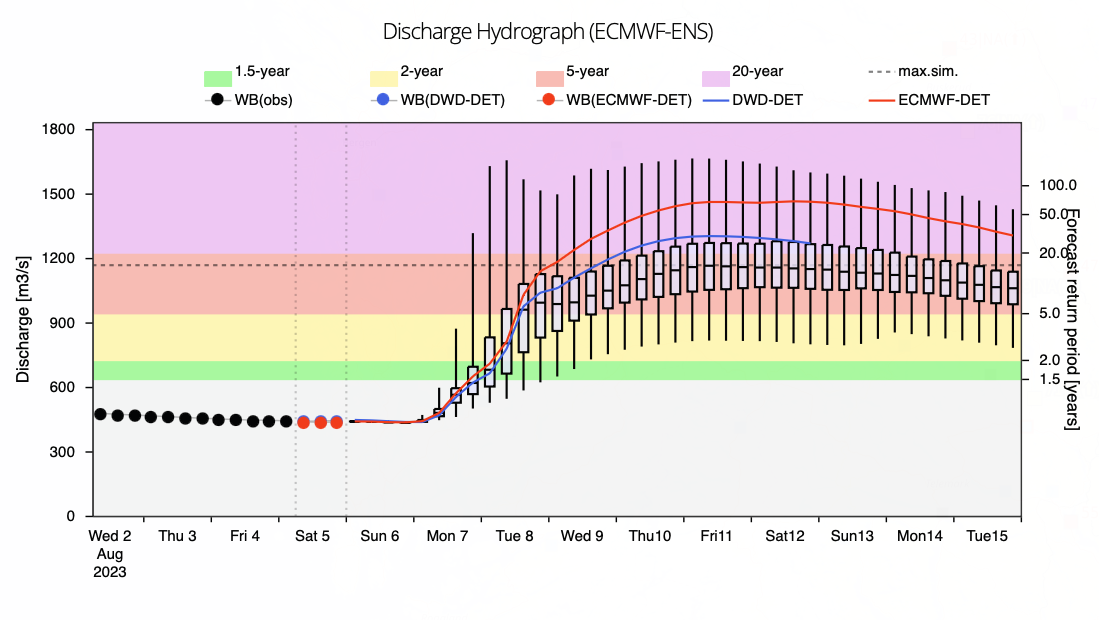
3.6 EFAS
The plots below show the river discharge for river Drammen close to the city of Drammen.