...
The plots below show EFI and SOT for total precipitation valid 25 February.


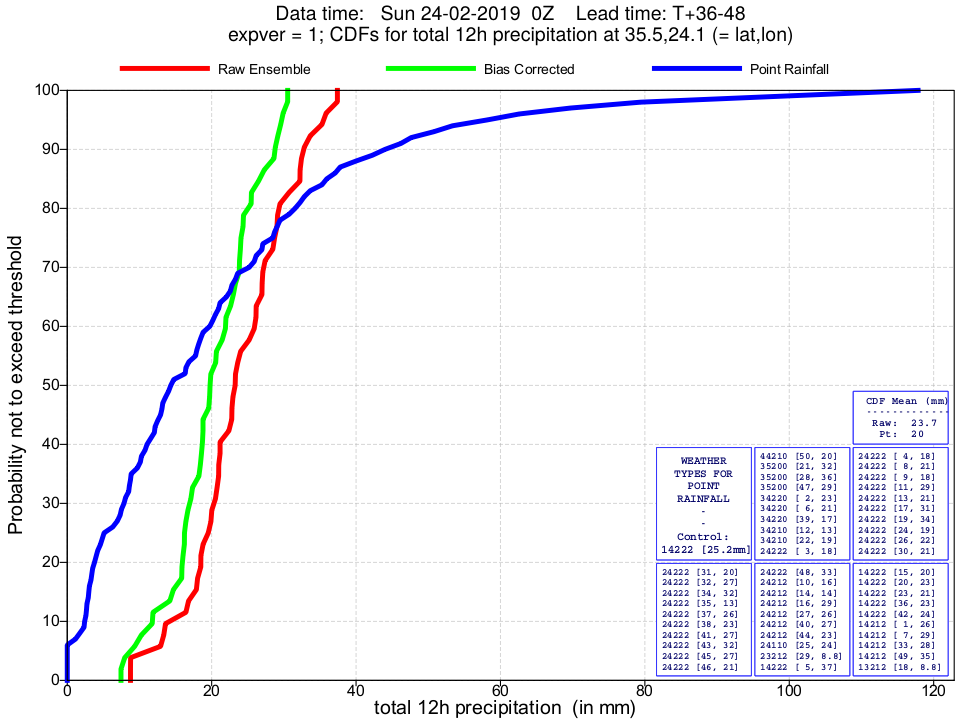
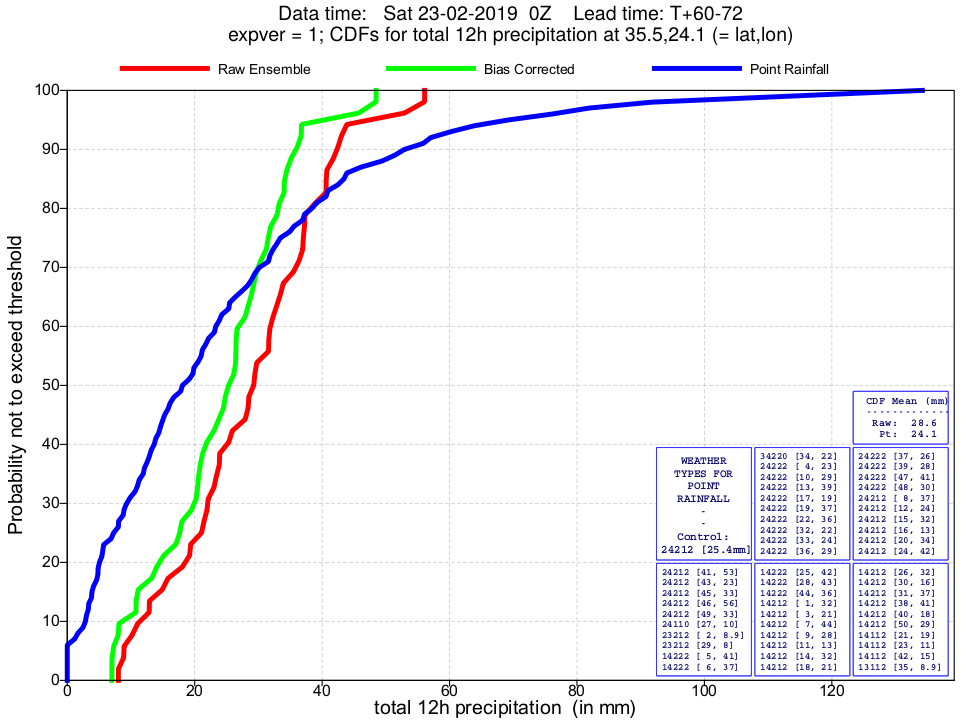
The plots below show the CDF for 12-hourly precipitation for Souda that recorded 116mm over the period. The plots include the raw ensemble (red), bias corrected raw ensemble (green) and EcPoint distribution to account to sub-grid variability (blue).


The plot below shows the evolution of forecast for the 24-hour precipitation valid 20 August for Sempronas (35.4N,23.8E). The plot includes ensemble (blue box-and-whisker), HRES (red dot) and model climate (red box-and-whisker).
3.4 Monthly forecasts
3.5 Comparison with other centres
...