...
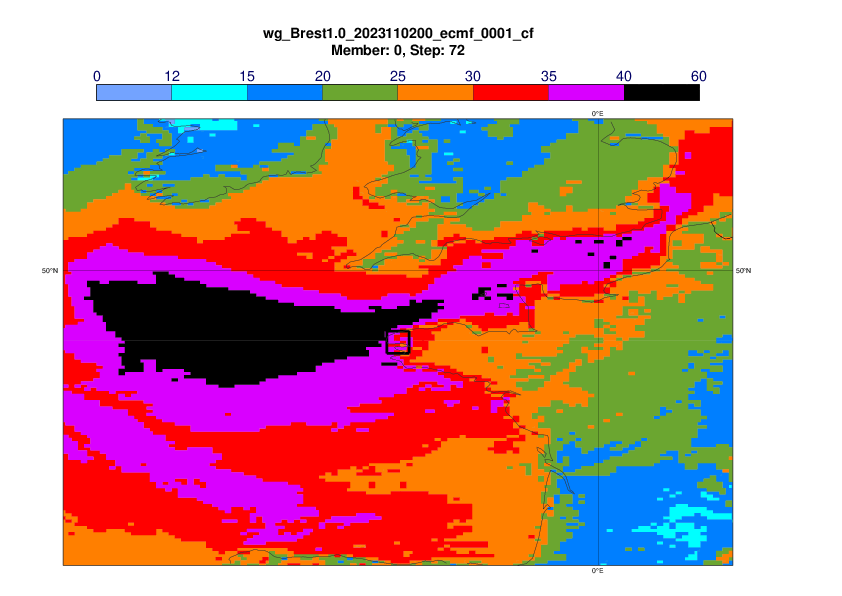
The plots below show 24-hour maximum wind gusts (2 November 00UTC - 3 November 00UTC) in observations (first plot) concatenated short forecasts (second plot) and ENS control forecasts with different lead times.


The plots below show 24-hour precipitation(2 November 00UTC - 3 November 00UTC) in observations (first plot) concatenated short forecasts (second plot) and ENS control forecasts with different lead times, focus on Tuscany, Italy. The observation plot will be updated once we have the HDOBS from Italy.


3.3 ENS
The plots below shows EFI for 1-day maximum wind gusts (2 November) from different initial dates.
...
The plots below show the cyclone feature maps valid 2 November 00UTC, with the dots coloured by the maximum wind speed at 1 km within 300 km radius. The isobars show the control forecast.
...
The plot below shows the forecast evolution plot for 24-hour maximum wind gust (2 November) inside a 0.5x0.5 box around Brest, Brittany. Observation - green hourglass, concatenated 6-hour forecasts - green dot, ENS control –red, ENS blue box-and-whisker, Model climate – cyan box-and-whisker. Ensemble mean as black diamonds. Triangle marks the maximum in the model climate based on 1600 forecasts.

The plot below shows the forecast evolution plot for 24-hour precipitation (2 November) inside a 0.5x0.5 box in northern Tuscany, Italy. Observation - green hourglass (to be added once we have HDOBS), concatenated 6-hour forecasts - green dot, ENS control –red, ENS blue box-and-whisker, Model climate – cyan box-and-whisker. Ensemble mean as black diamonds. Triangle marks the maximum in the model climate based on 1600 forecasts (to be added).

The plot below shows the the forecast evolution plot for maximum significant wave height based on 00, 06, 12 and 18UTC on 2 November inside a 0.25x0.25 box around Les Pierres Noires off the coast of Brittany. Concatenated 6-hour forecasts - green dot, ENS control –red, ENS blue box-and-whisker, Model climate – cyan box-and-whisker. Ensemble mean as black diamonds. Triangle marks the maximum in the model climate based on 1600 forecasts. Below is also the map of the waves based on the analyses included, with the analysed box outliined.
...