...
The plot below shows the snow depth at 06UTC on 4 January in Sweden.
...
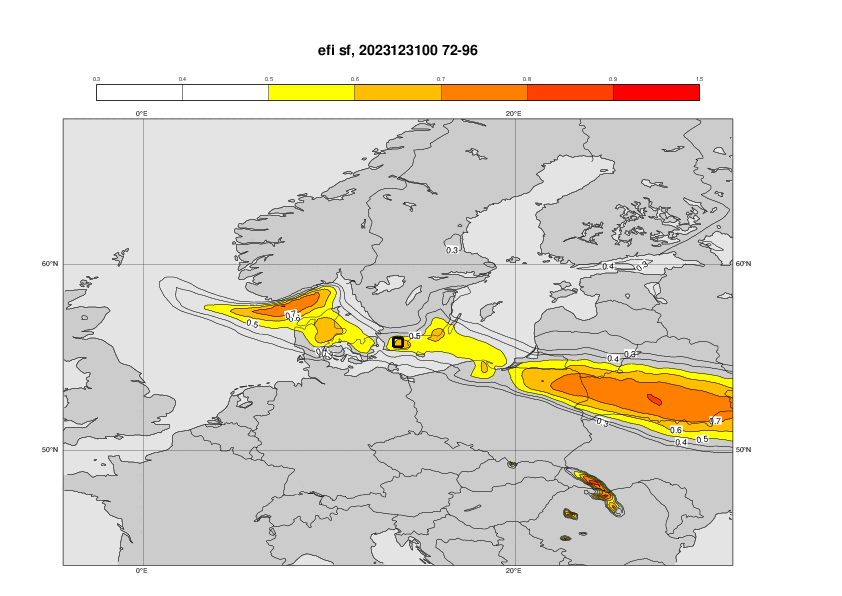
The plots below shows EFI and SOT for 1-day snowfall (3 January) from different initial dates.


The plot below shows the forecast evolution plot for 24-hour snowfall (3 january) for points inside a 0.5x0.5 box over eastern Skane. Concatenated 6-hour forecasts - green dot, ENS control –red, , ENS blue box-and-whisker, Model climate – cyan box-and-whisker. Ensemble mean as black diamonds. Triangle marks the maximum in the model climate based on 1800 forecasts.

3.4 Monthly forecasts
3.5 Comparison with other centres
...
5. Good and bad aspects of the forecasts for the event
...
- Good signal 3 days in advance for the extreme snofall in parts of southern Sweden.