...
3.1 Data assimilation
3.2 HRES
3.3 ENS
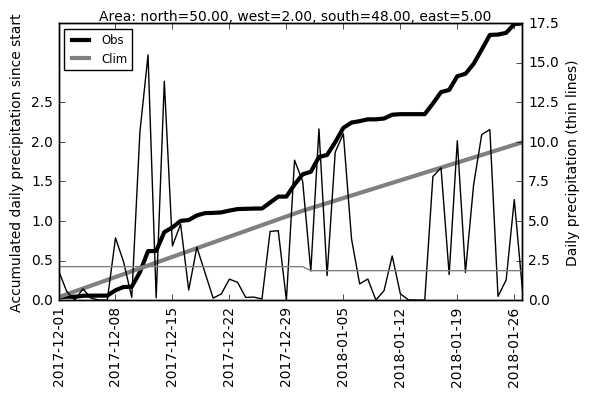
The plot below shows the accumulated precipitation from 1 December 2017 aggregated from ~15 stations upstream Paris (in the box 48-50N, 2-5E), from observations (black) and ensemble mean forecasts with different lead times. The accumulation from climatology is shown is grey. Also the longest lead time (15-day forecasts) captured half of the observed wet anomaly. The information missing in this plot is whether the model on this lead time has a bias and optimally the plot should include the accumulation from the model climate as well.
3.4 Monthly forecasts
The figure below shows the analysed weekly precipitation 15-22 January (first panel) and weekly means from monthly forecasts.
...