Status: Finalised Material from: Linus
1. Impact
During the last weekend of January River Seine flooded in Paris, with a level of 5.8 metres (June 2016 peaked on 6.1 m).
http://www.bbc.co.uk/news/world-europe-42856634
2. Description of the event
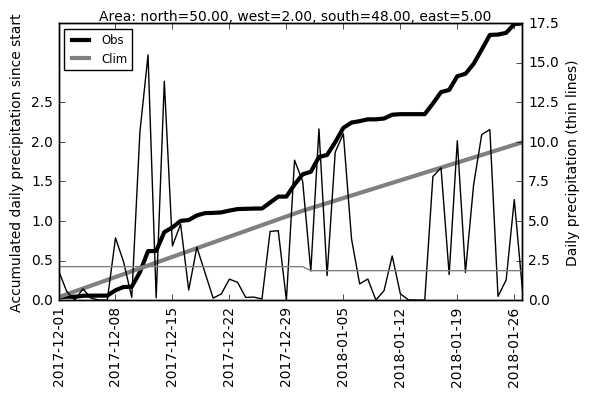
The plot below shows the accumulated precipitation from 1 December 2017 aggregated from ~15 stations upstream Paris (in the box 48-50N, 2-5E). Te region experienced three wet periods, where the last one happened between 16-23 January.
3. Predictability
3.1 Data assimilation
3.2 HRES
3.3 ENS
The plot below shows the accumulated precipitation from 1 December 2017 aggregated from ~15 stations upstream Paris (in the box 48-50N, 2-5E), from observations (black) and ensemble mean forecasts with different lead times. The accumulation from climatology is shown is grey. Also the longest lead time (15-day forecasts) captured half of the observed wet anomaly. The information missing in this plot is whether the model on this lead time has a bias and optimally the plot should include the accumulation from the model climate as well.

3.4 Monthly forecasts
The figure below shows the analysed weekly precipitation 15-22 January (first panel) and weekly means from monthly forecasts.

The next plot shows the same as above but for MSLP.

3.5 Comparison with other centres
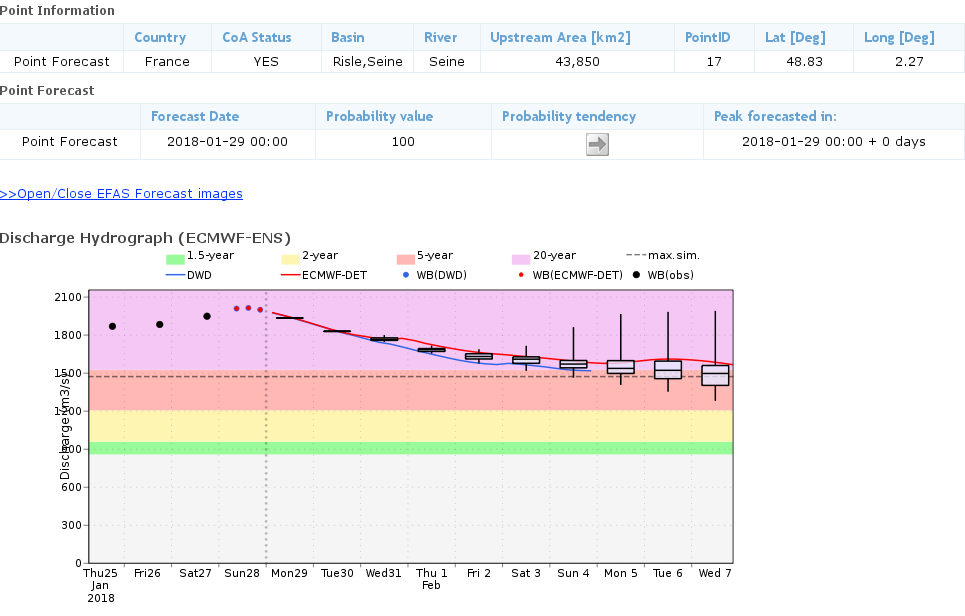
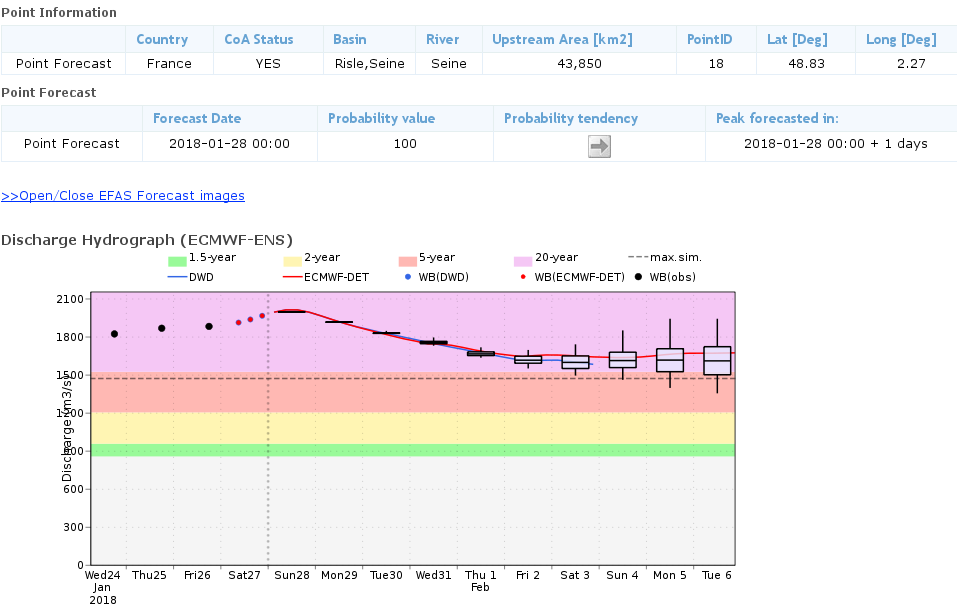
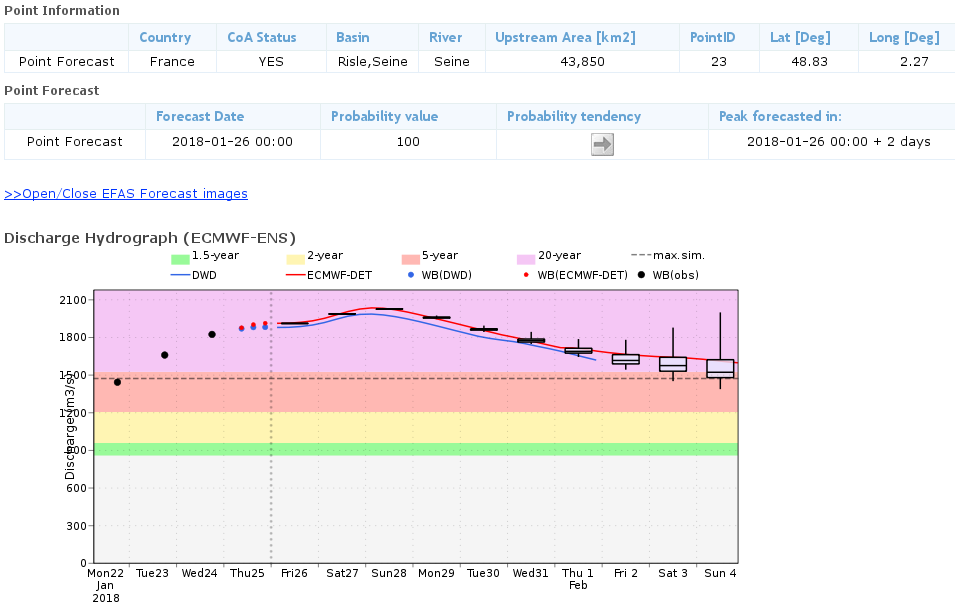
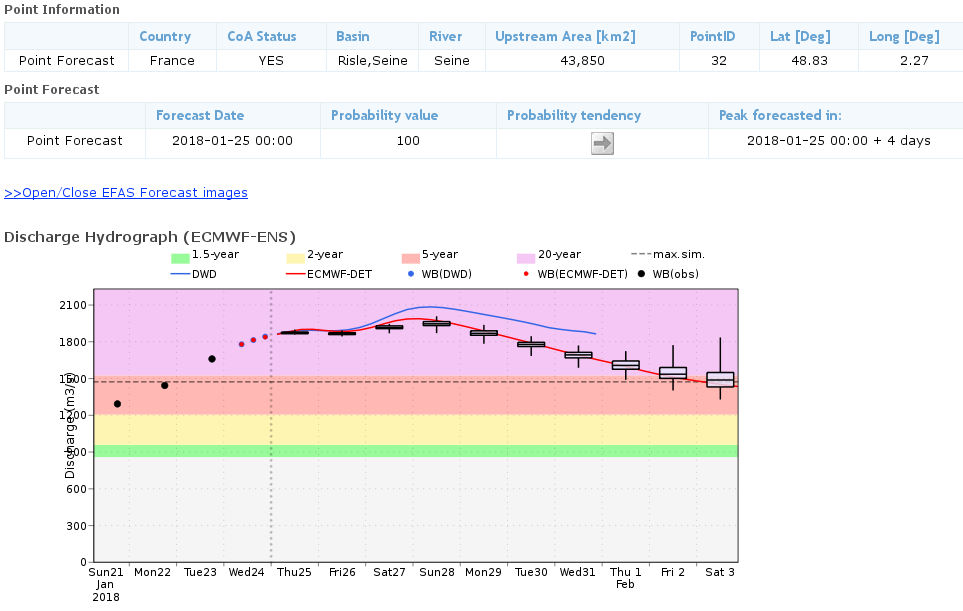
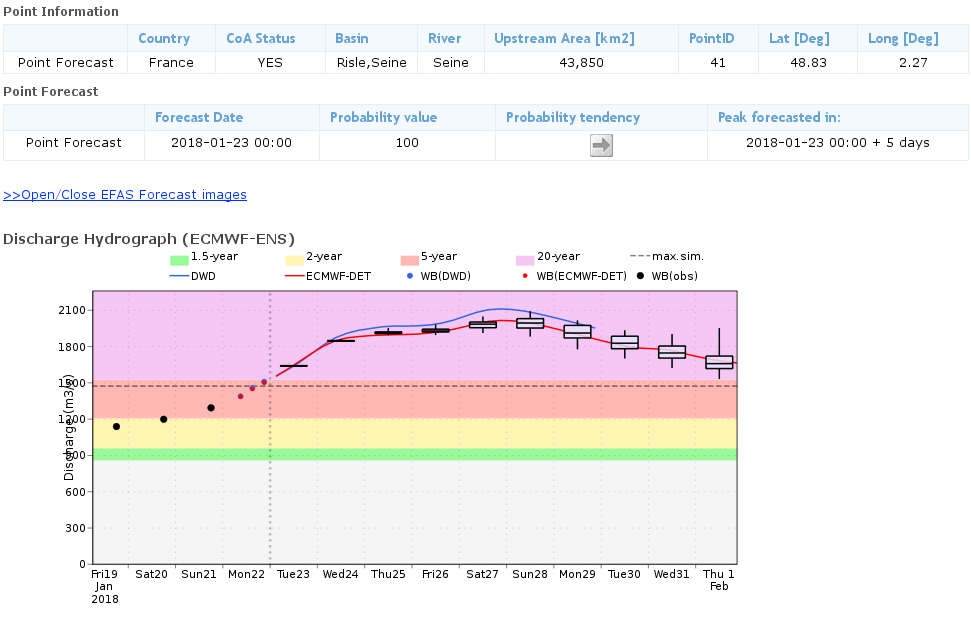
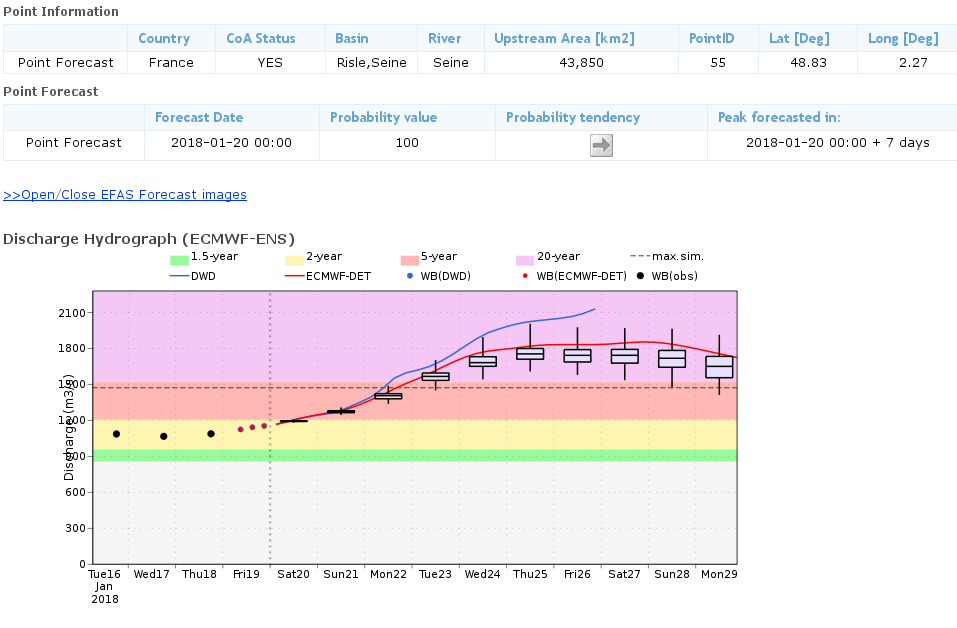
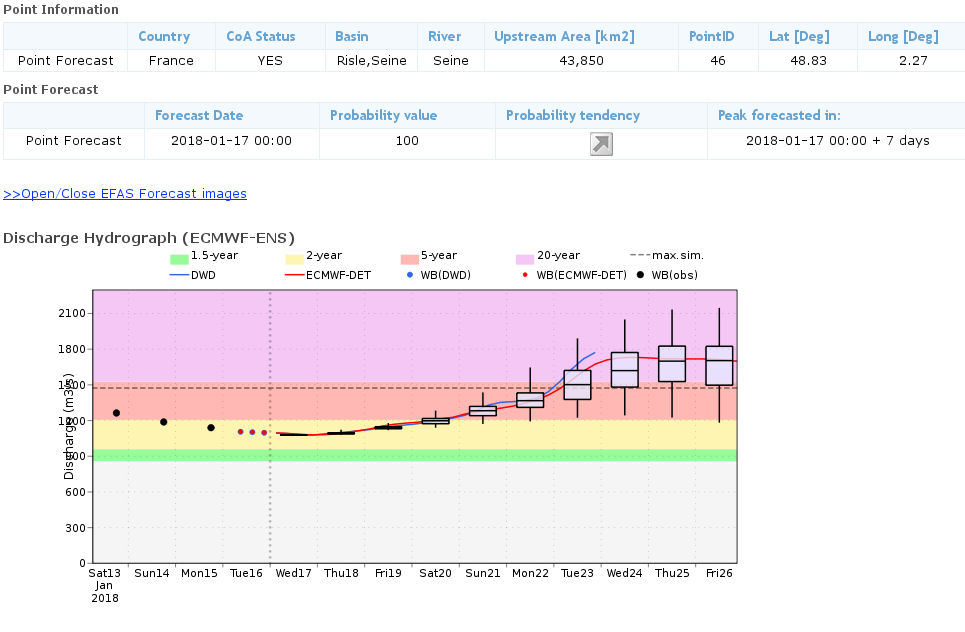
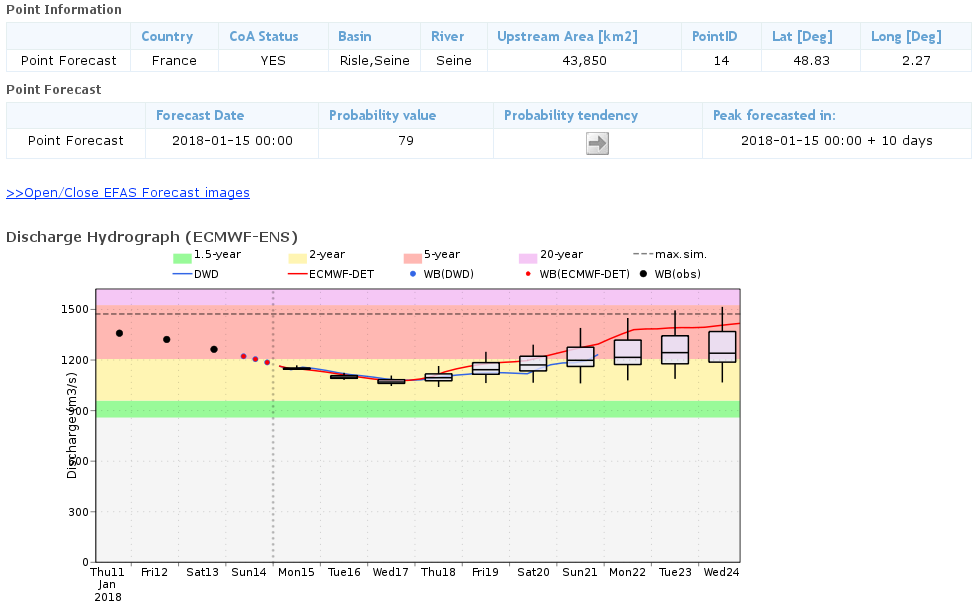
3.6 EFAS
The plots below show EFAS forecasts for a point on Seine in Paris, starting from the last forecast. The risk of exceed 20 year return period (purple band) was well captured from 17 January.