...
The plots below show the same as above but for SST anomalies. The precipitation anomalies are linked to warm SST along the coast, with also was well captured in February but missed in January. The forecasts from December, November and October had the coastal anomaly as well.


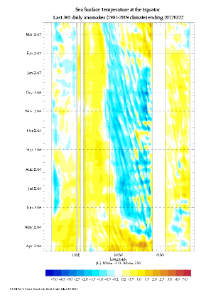
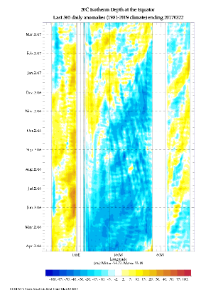
The plots below show Howmuller diagram of SST (left) and depth of 20C isoterm (right) along the equator from the ocean analysis. There are signs of a Kelvin wave propagating from west to east, starting in October and reached the South-American coast in February.
3.5 Comparison with other centres
...